Lead Designer, Operations Dashboard
7 pages, live prototype
5 designers
6 weeks
Figma / Variables
What is Svaroots?
A conceptual modular footwear brand built around interchangeable components, regional Indian textiles, and post-purchase ownership.
Svaroots reimagines the sneaker as a system — a base shoe paired with swappable patches crafted in regional Indian textiles like Kalamkari, Ajrak, Paithani, and Bandhani. Buyers don't just purchase a product; they enter an evolving relationship with it.
The brand sits at the intersection of craft heritage and modular design exploring how products can be personalised, refurbished, and resold without losing identity. Every patch tells a regional story; every shoe carries a lifecycle.
The entire dashboard, end to end.
I led research, information architecture, design system, UI, interaction states, and developer handoff across all seven screens.
- Overview with KPIs, traffic sources, customer insights
- Orders with status filters and management
- Inventory with size run health, dead stock
- Users with CLV, segmentation, at-risk tracking
- Content & CMS with products, banners, campaigns
- Analytics with patch-to-sneaker ratio, customisation rate
- Settings with team roles and permissions
Brand, product, & consumer surface.
These were collaborative efforts across the full team. The dashboard was my individual contribution to the product.
- Logo & brand identity
- Modular sneaker concept
- Consumer storefront & 3D customizer
- Marketing & pitch materials
The product the team built.
Quick context on Svaroots and the collaborative work that set the stage for the dashboard.
Brand Logo
A patch-shaped mark, made with spiral representing self identity

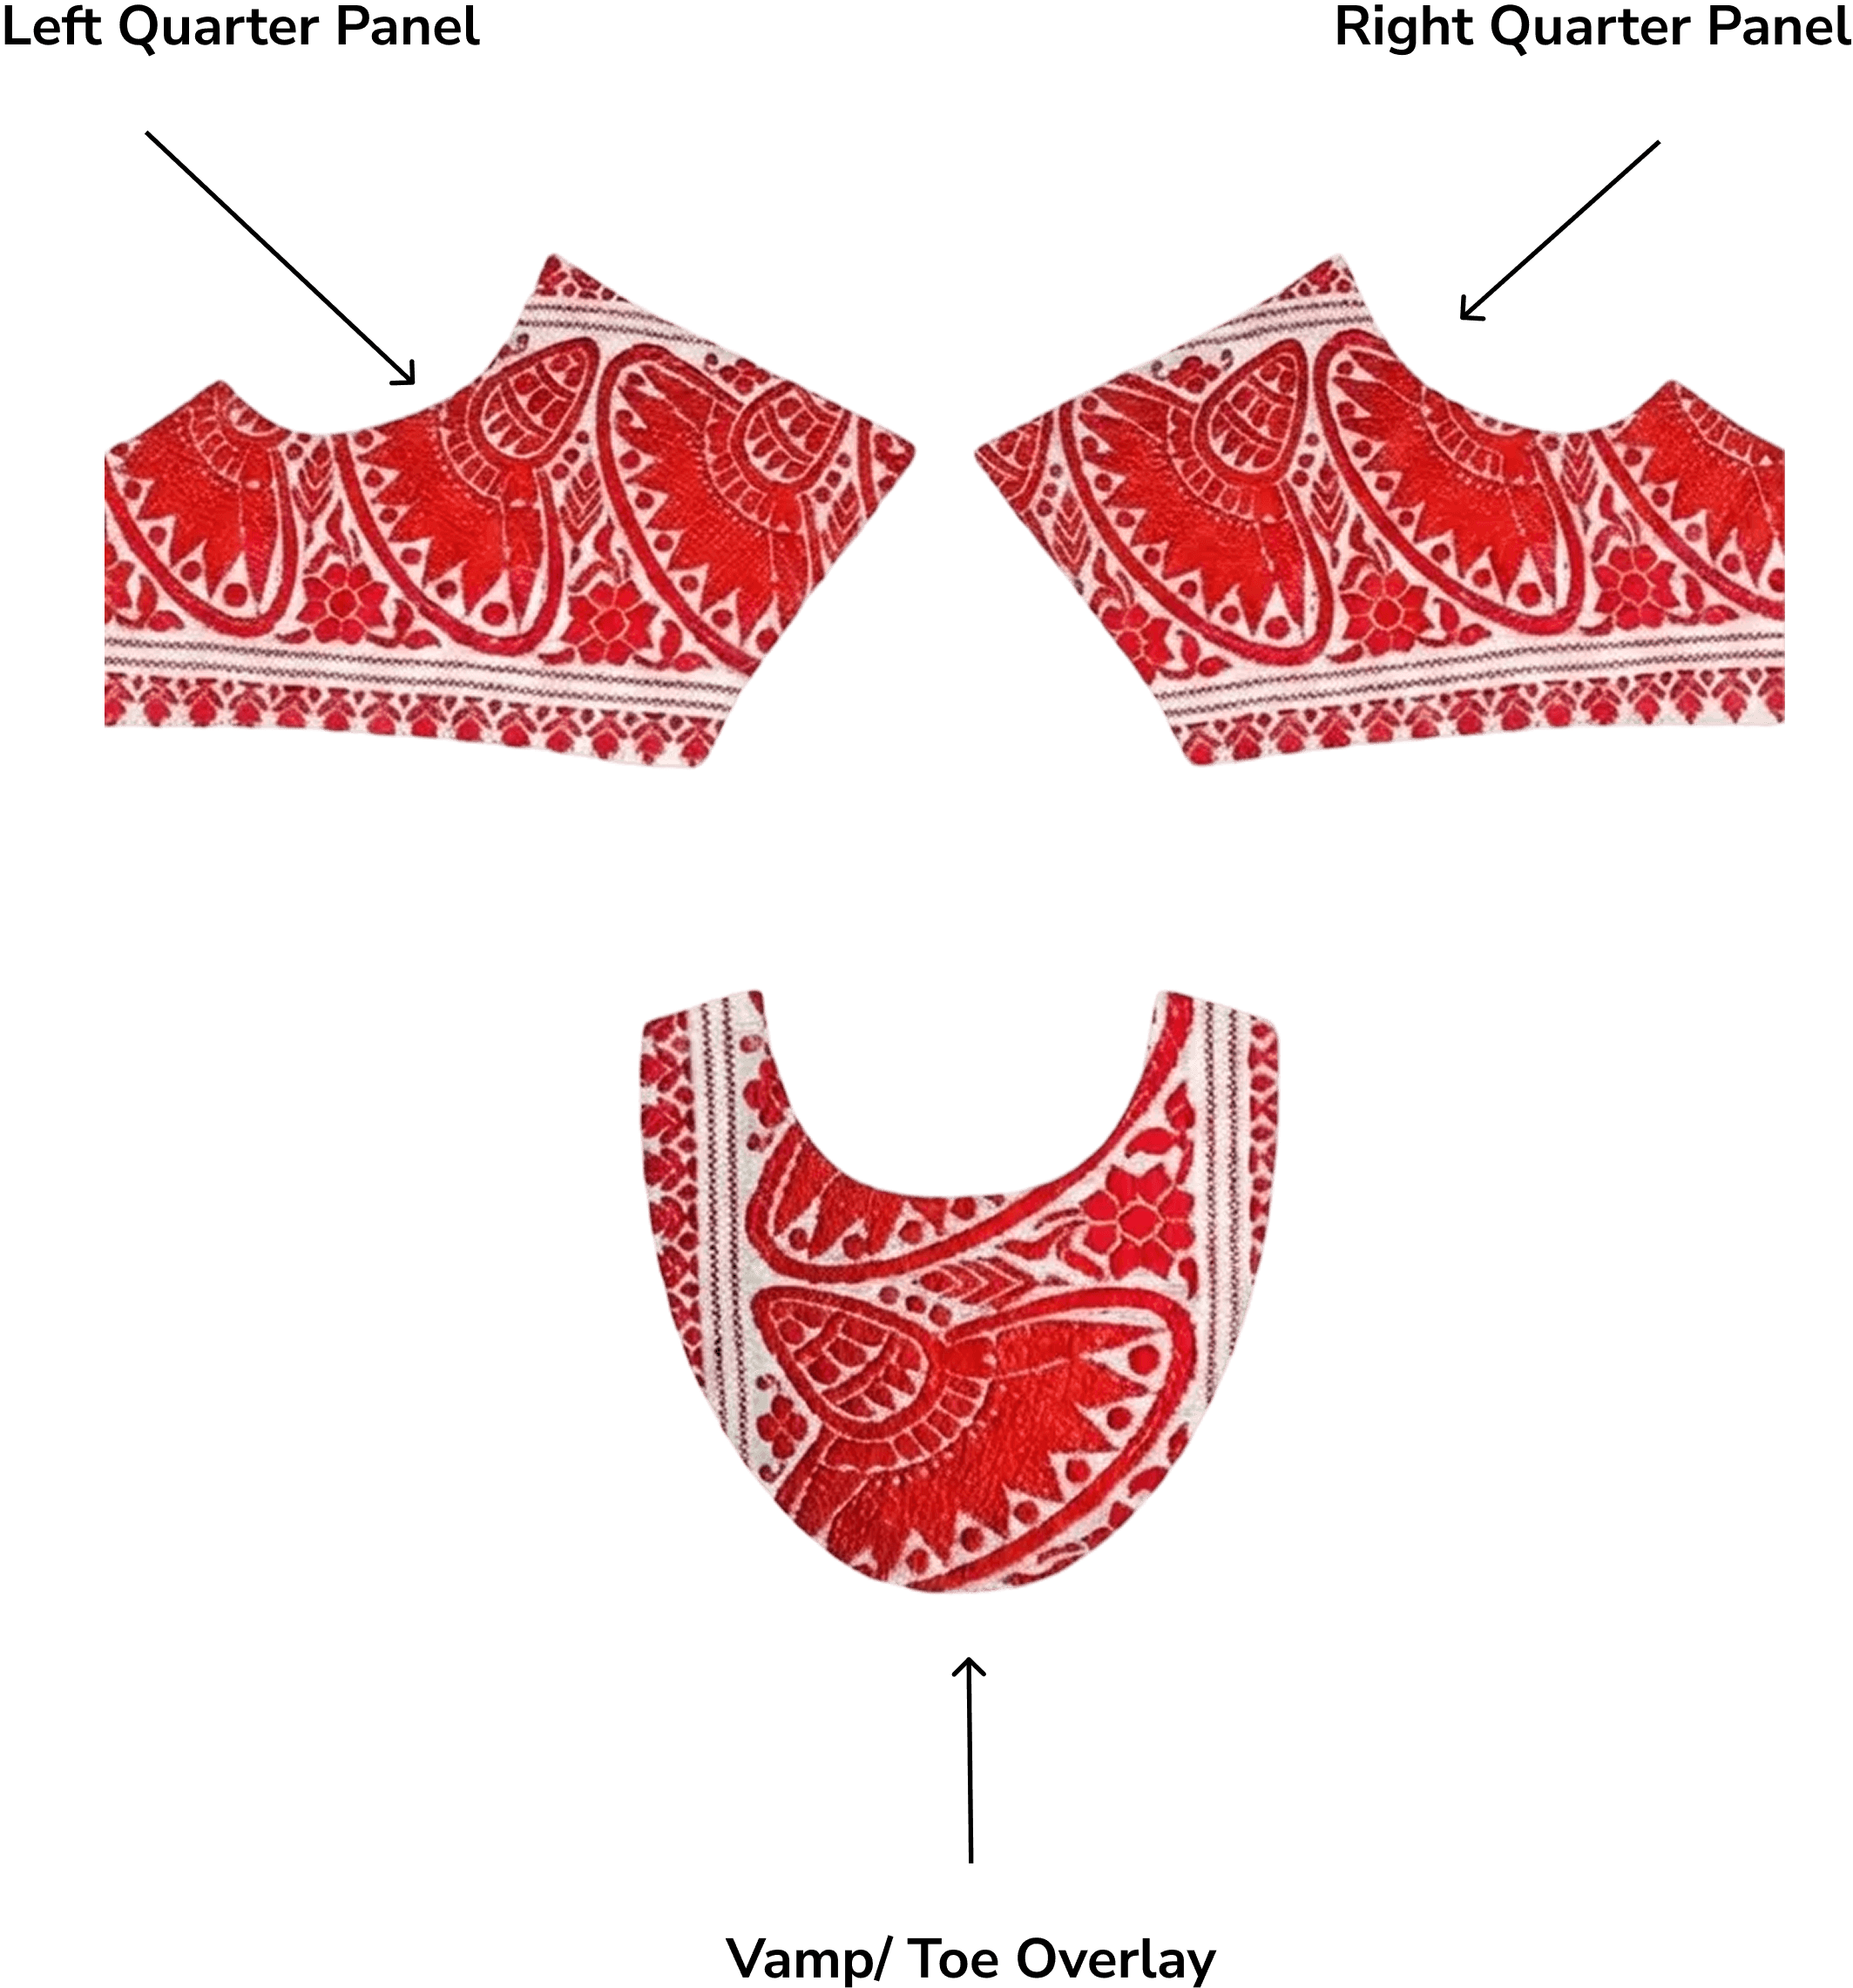
The product
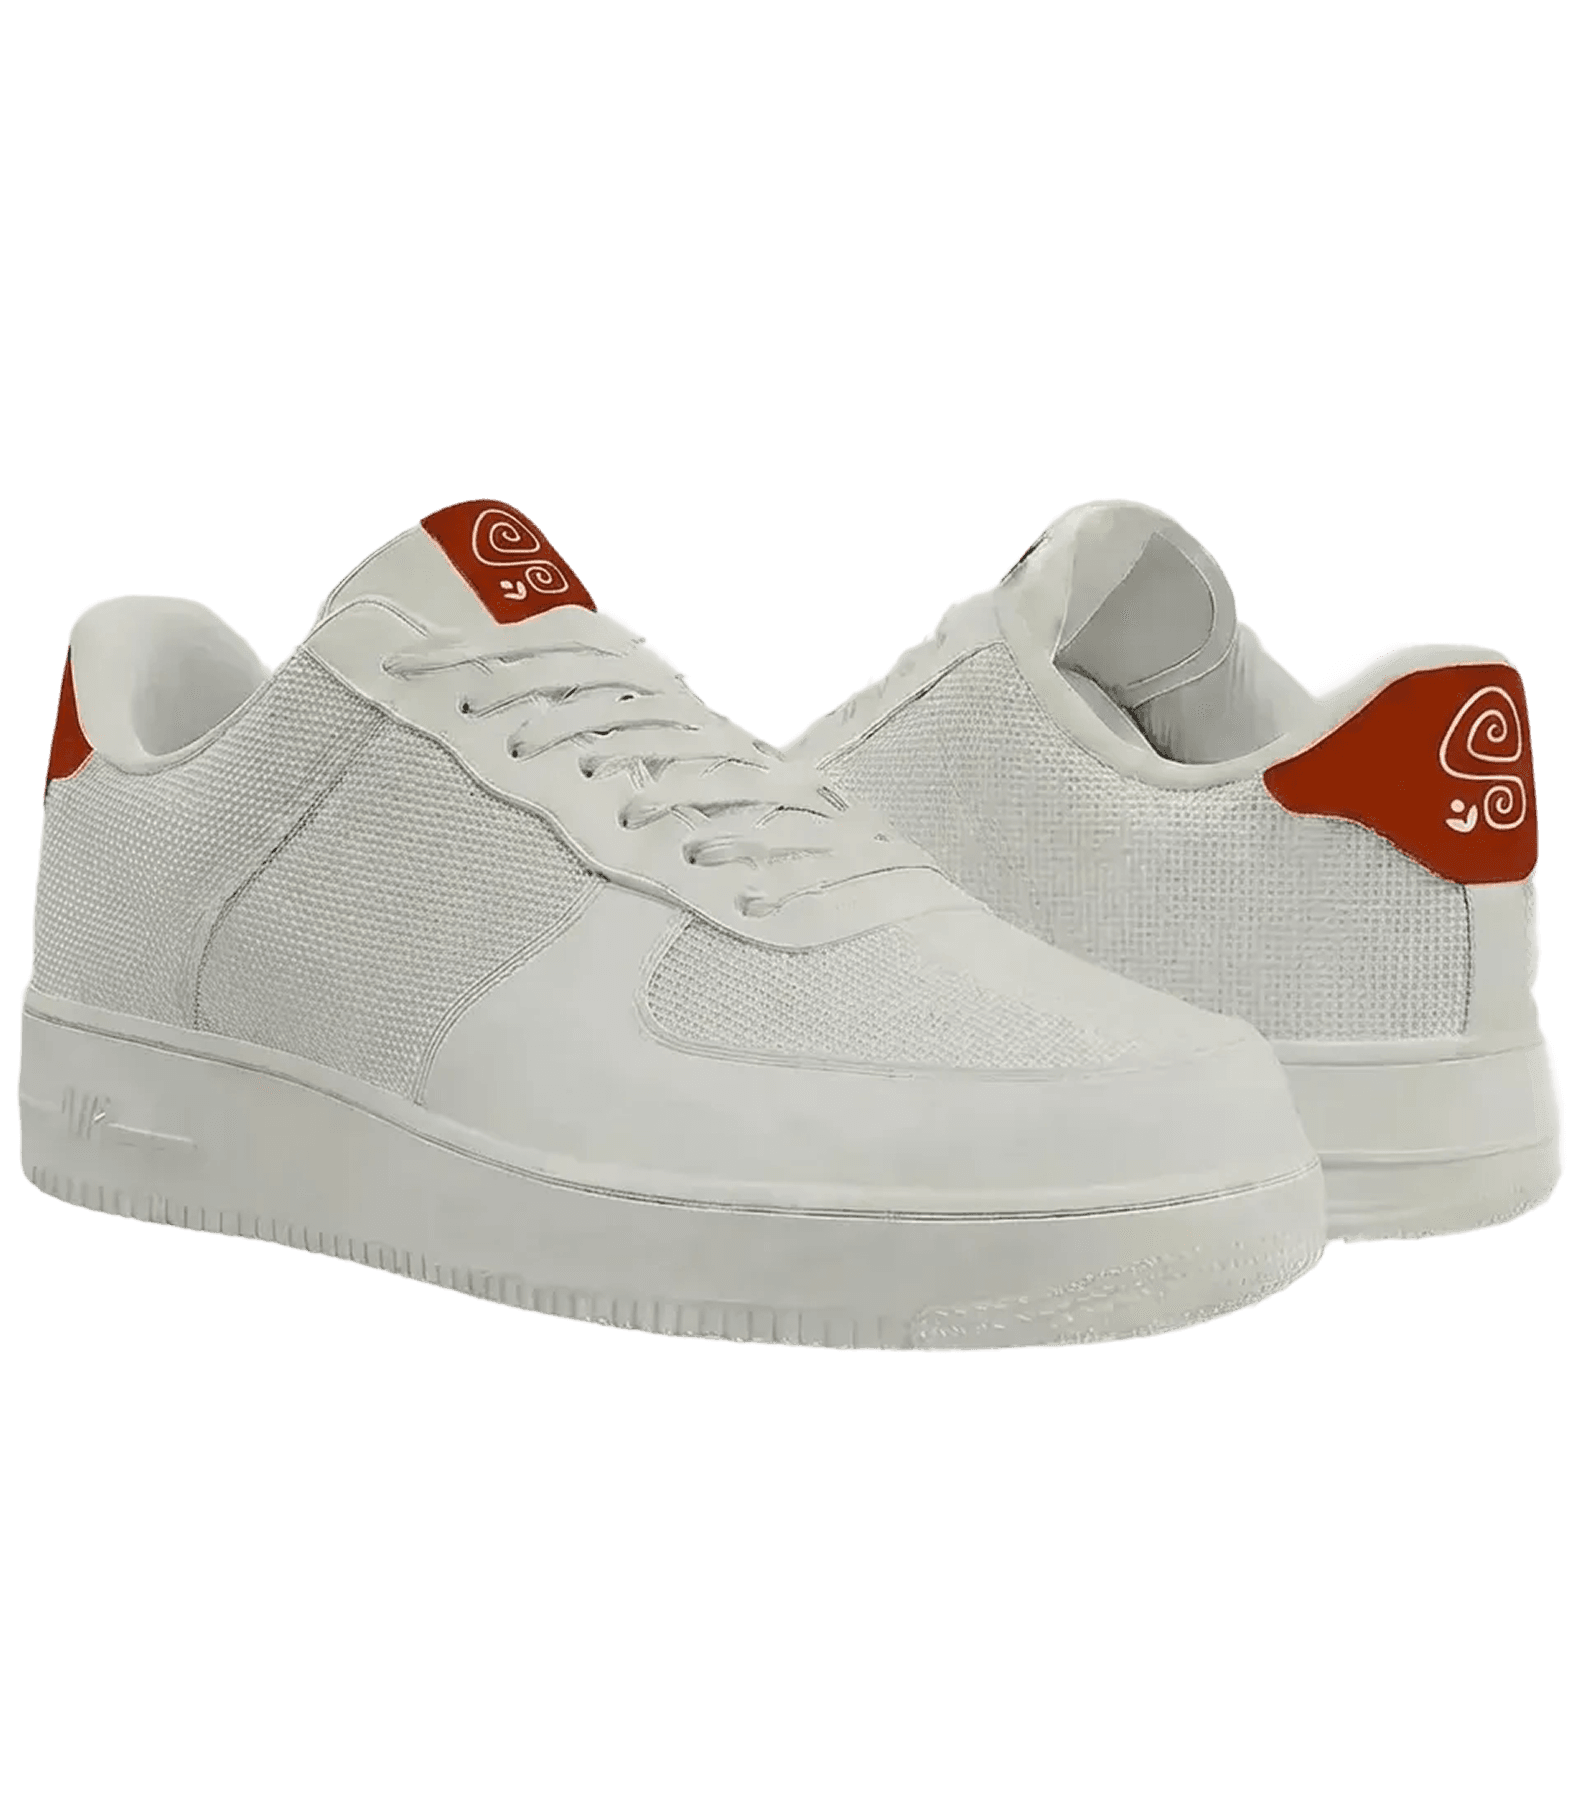
Base sneaker for Indian feet. Three modular zones accepting Kalamkari, Ajrak, Paithani, Bandhani patches.

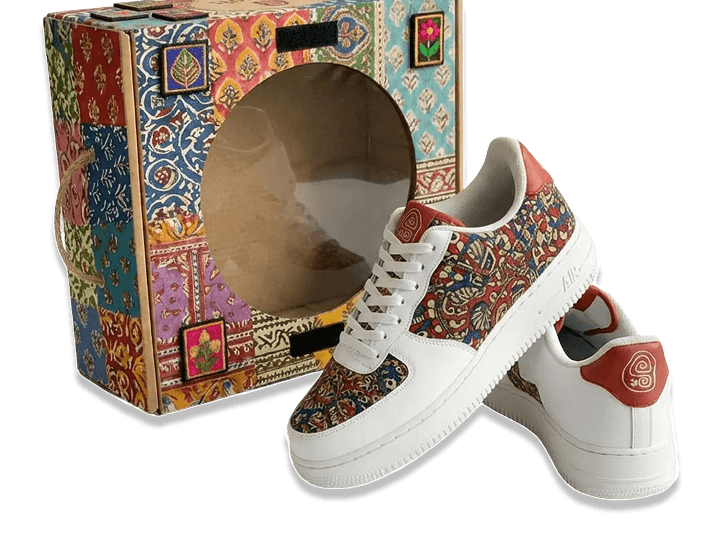
Packaging
Modular packaging system for sneakers, patches, and gifting kits. Designed to reflect the brand's textile heritage.
 Featured on Packaging of the World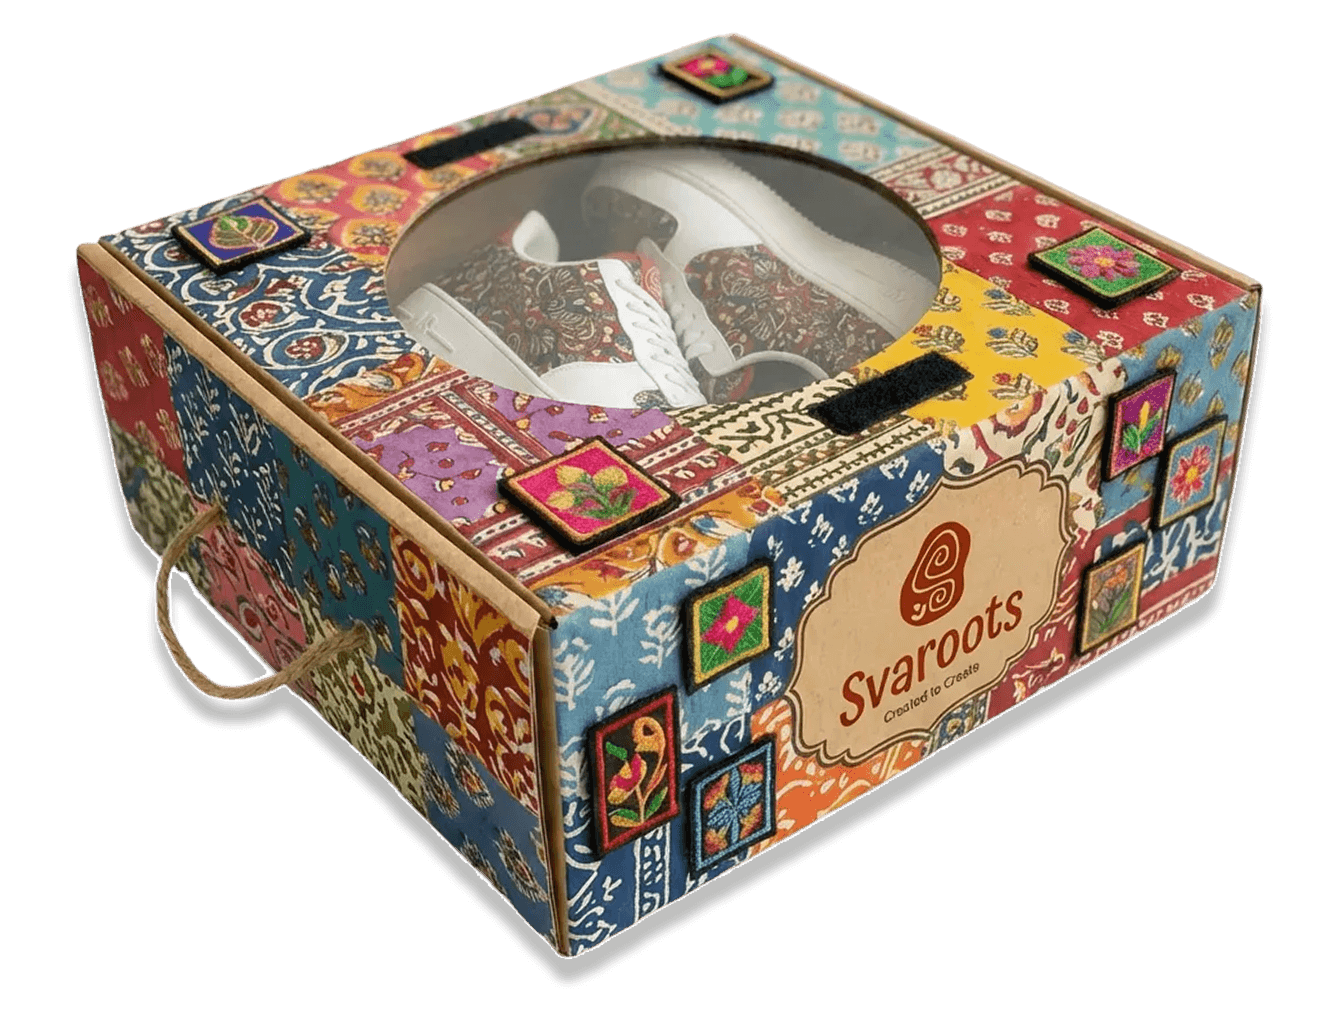
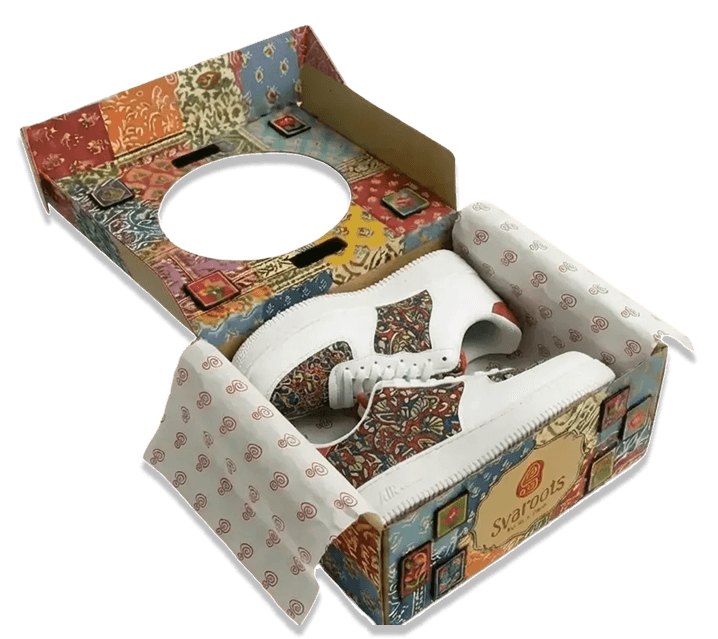
Consumer storefront
Home, 3D Lab, Community page. Where the buyer becomes a co-creator.
Once a customer hits "order", everything I designed kicks in.
Designing the operational layer.
Svaroots began as a conceptual modular footwear ecosystem exploring interchangeable products and circular ownership. As the system evolved, operational complexity around inventory, and lifecycle visibility became the design consideration this dashboard was built to address.
A modular shoe needs custom ops.
Svaroots sells a base sneaker plus swappable patches in regional Indian textiles. Five product types, each with its own lifecycle. If launched today, a modular brand like Svaroots would be forced to run on spreadsheets and a generic Shopify backend.
The ops team is flying blind.
Patches sell fast but restock slow. Sneakers need size-run tracking across Indian sizing (IND 7-11). Drops are time-limited. Cleaning and gifting kits follow yet another rhythm. A single Shopify dashboard treats them all identically, so the team can't see dead stock building, can't track the patch-to-sneaker ratio, and can't anticipate which sizes will stockout next.
Seven screens, one operations hub.
A custom dashboard that gives each product category its own view, surfaces the metrics only a modular brand needs, and lets a two-person ops team manage inventory, orders, users, content, and analytics without switching tools.
The storefront is where the magic happens. The dashboard is where it keeps happening.
Design hypothesis
Behind the system.
Information architecture for organizing the Svaroots operational dashboard.
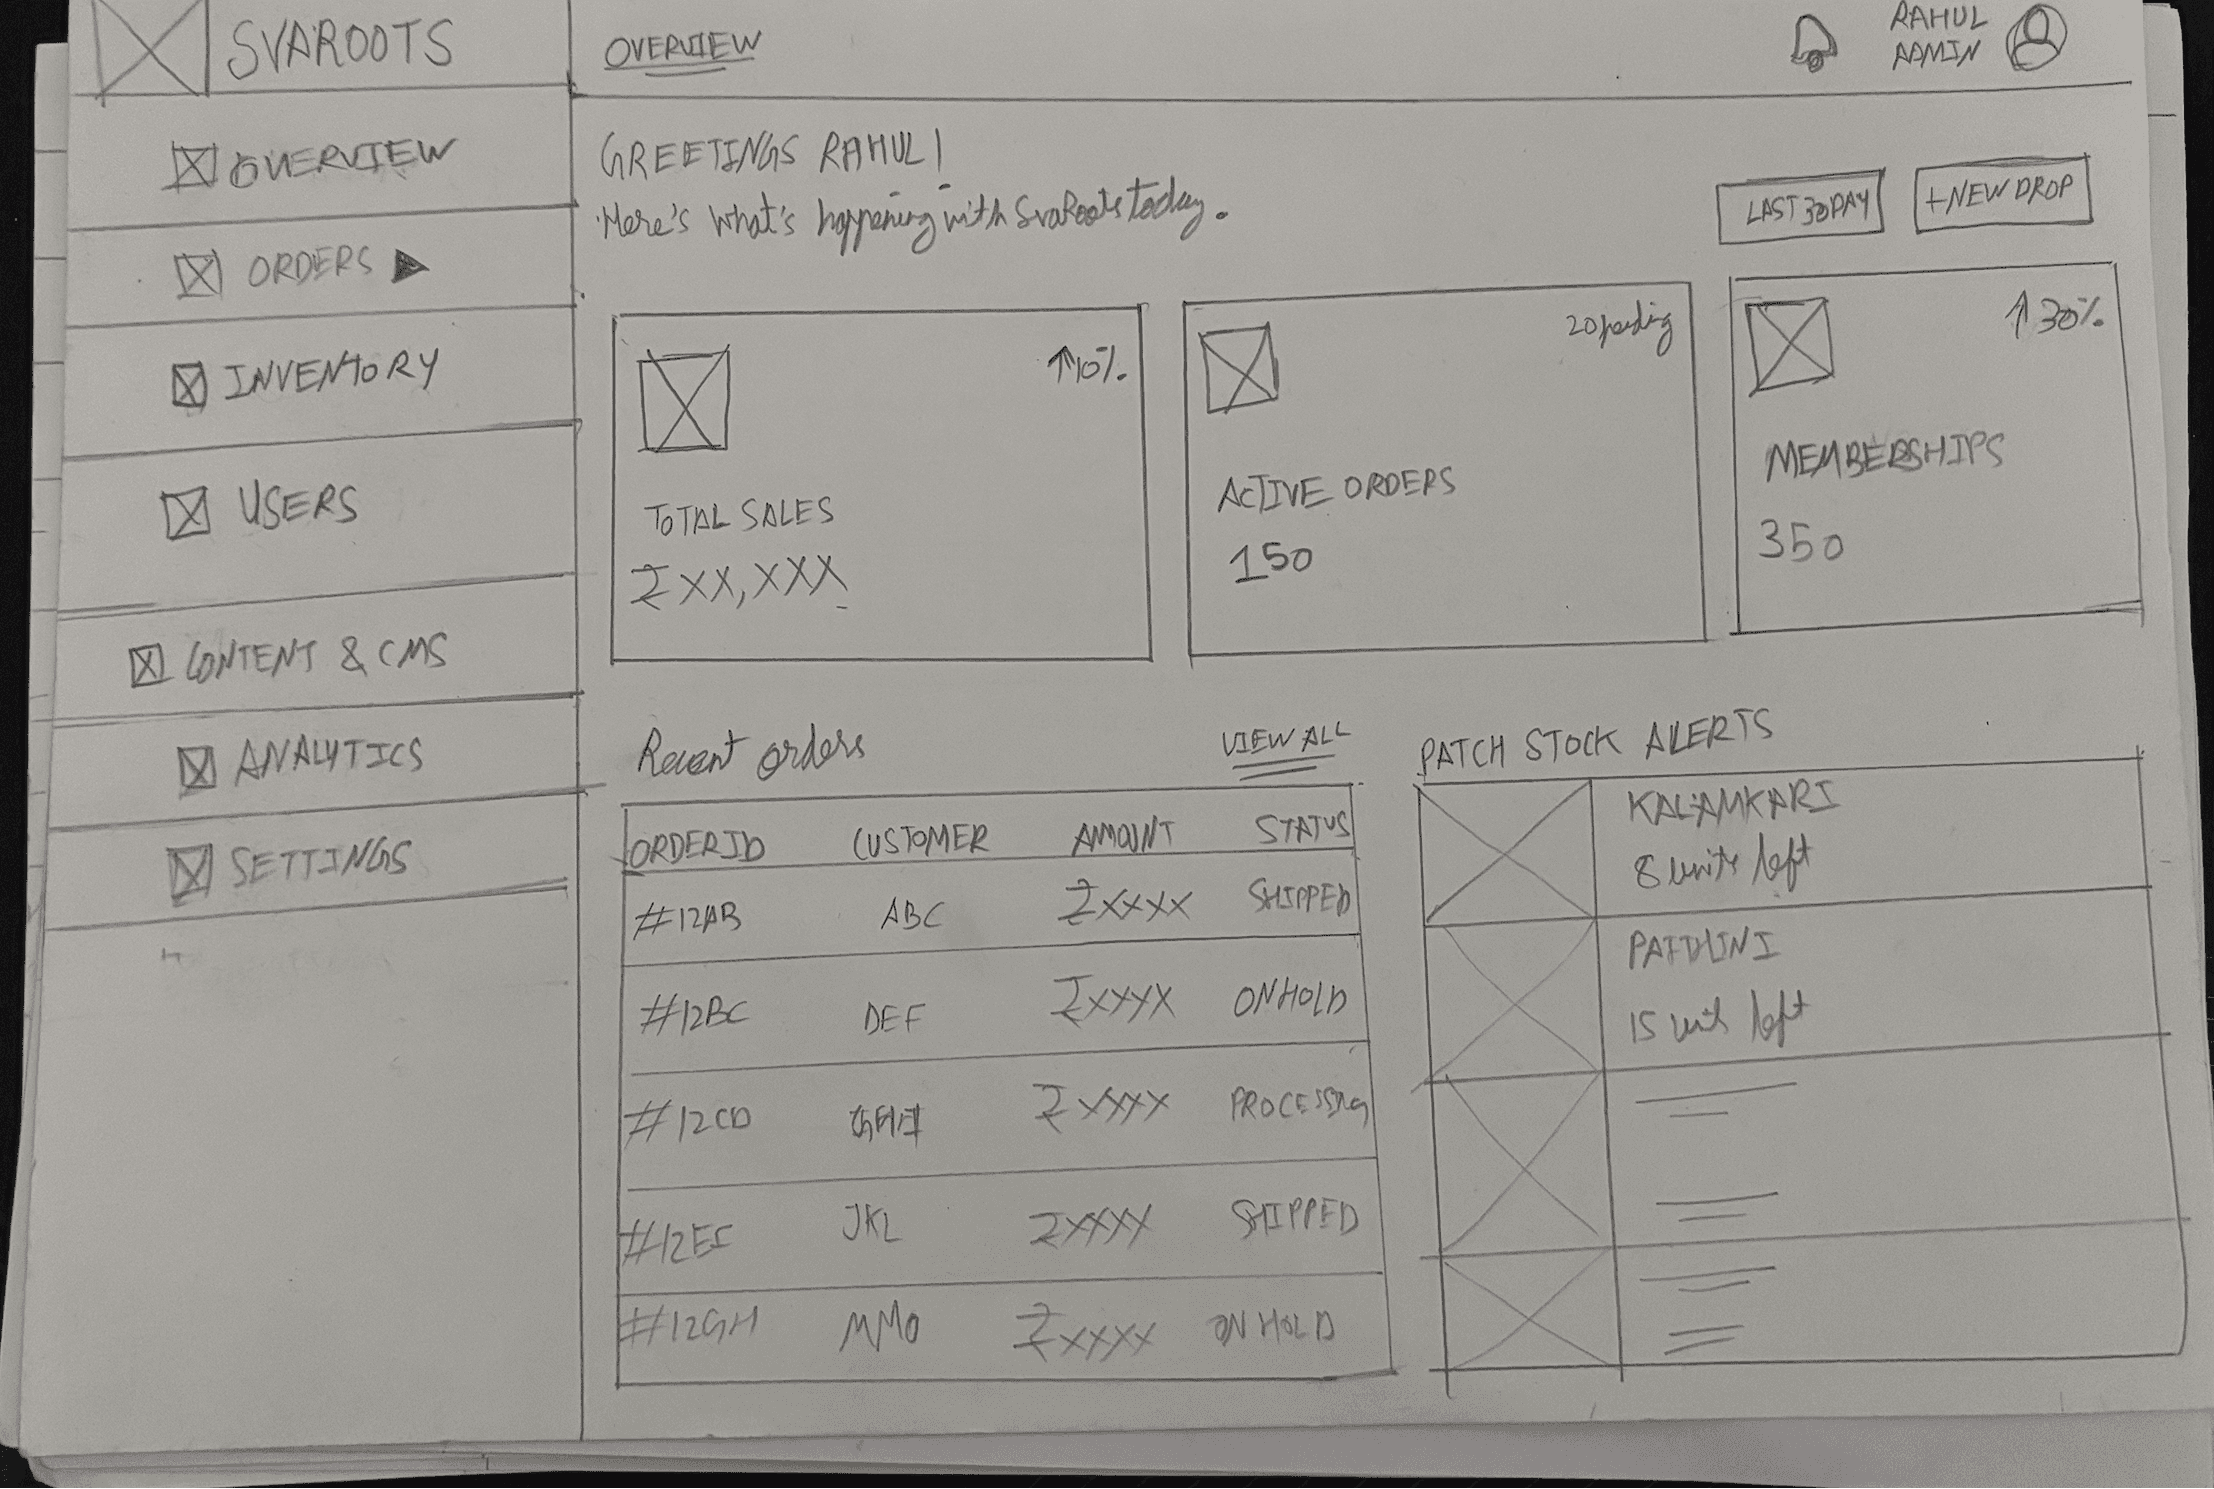
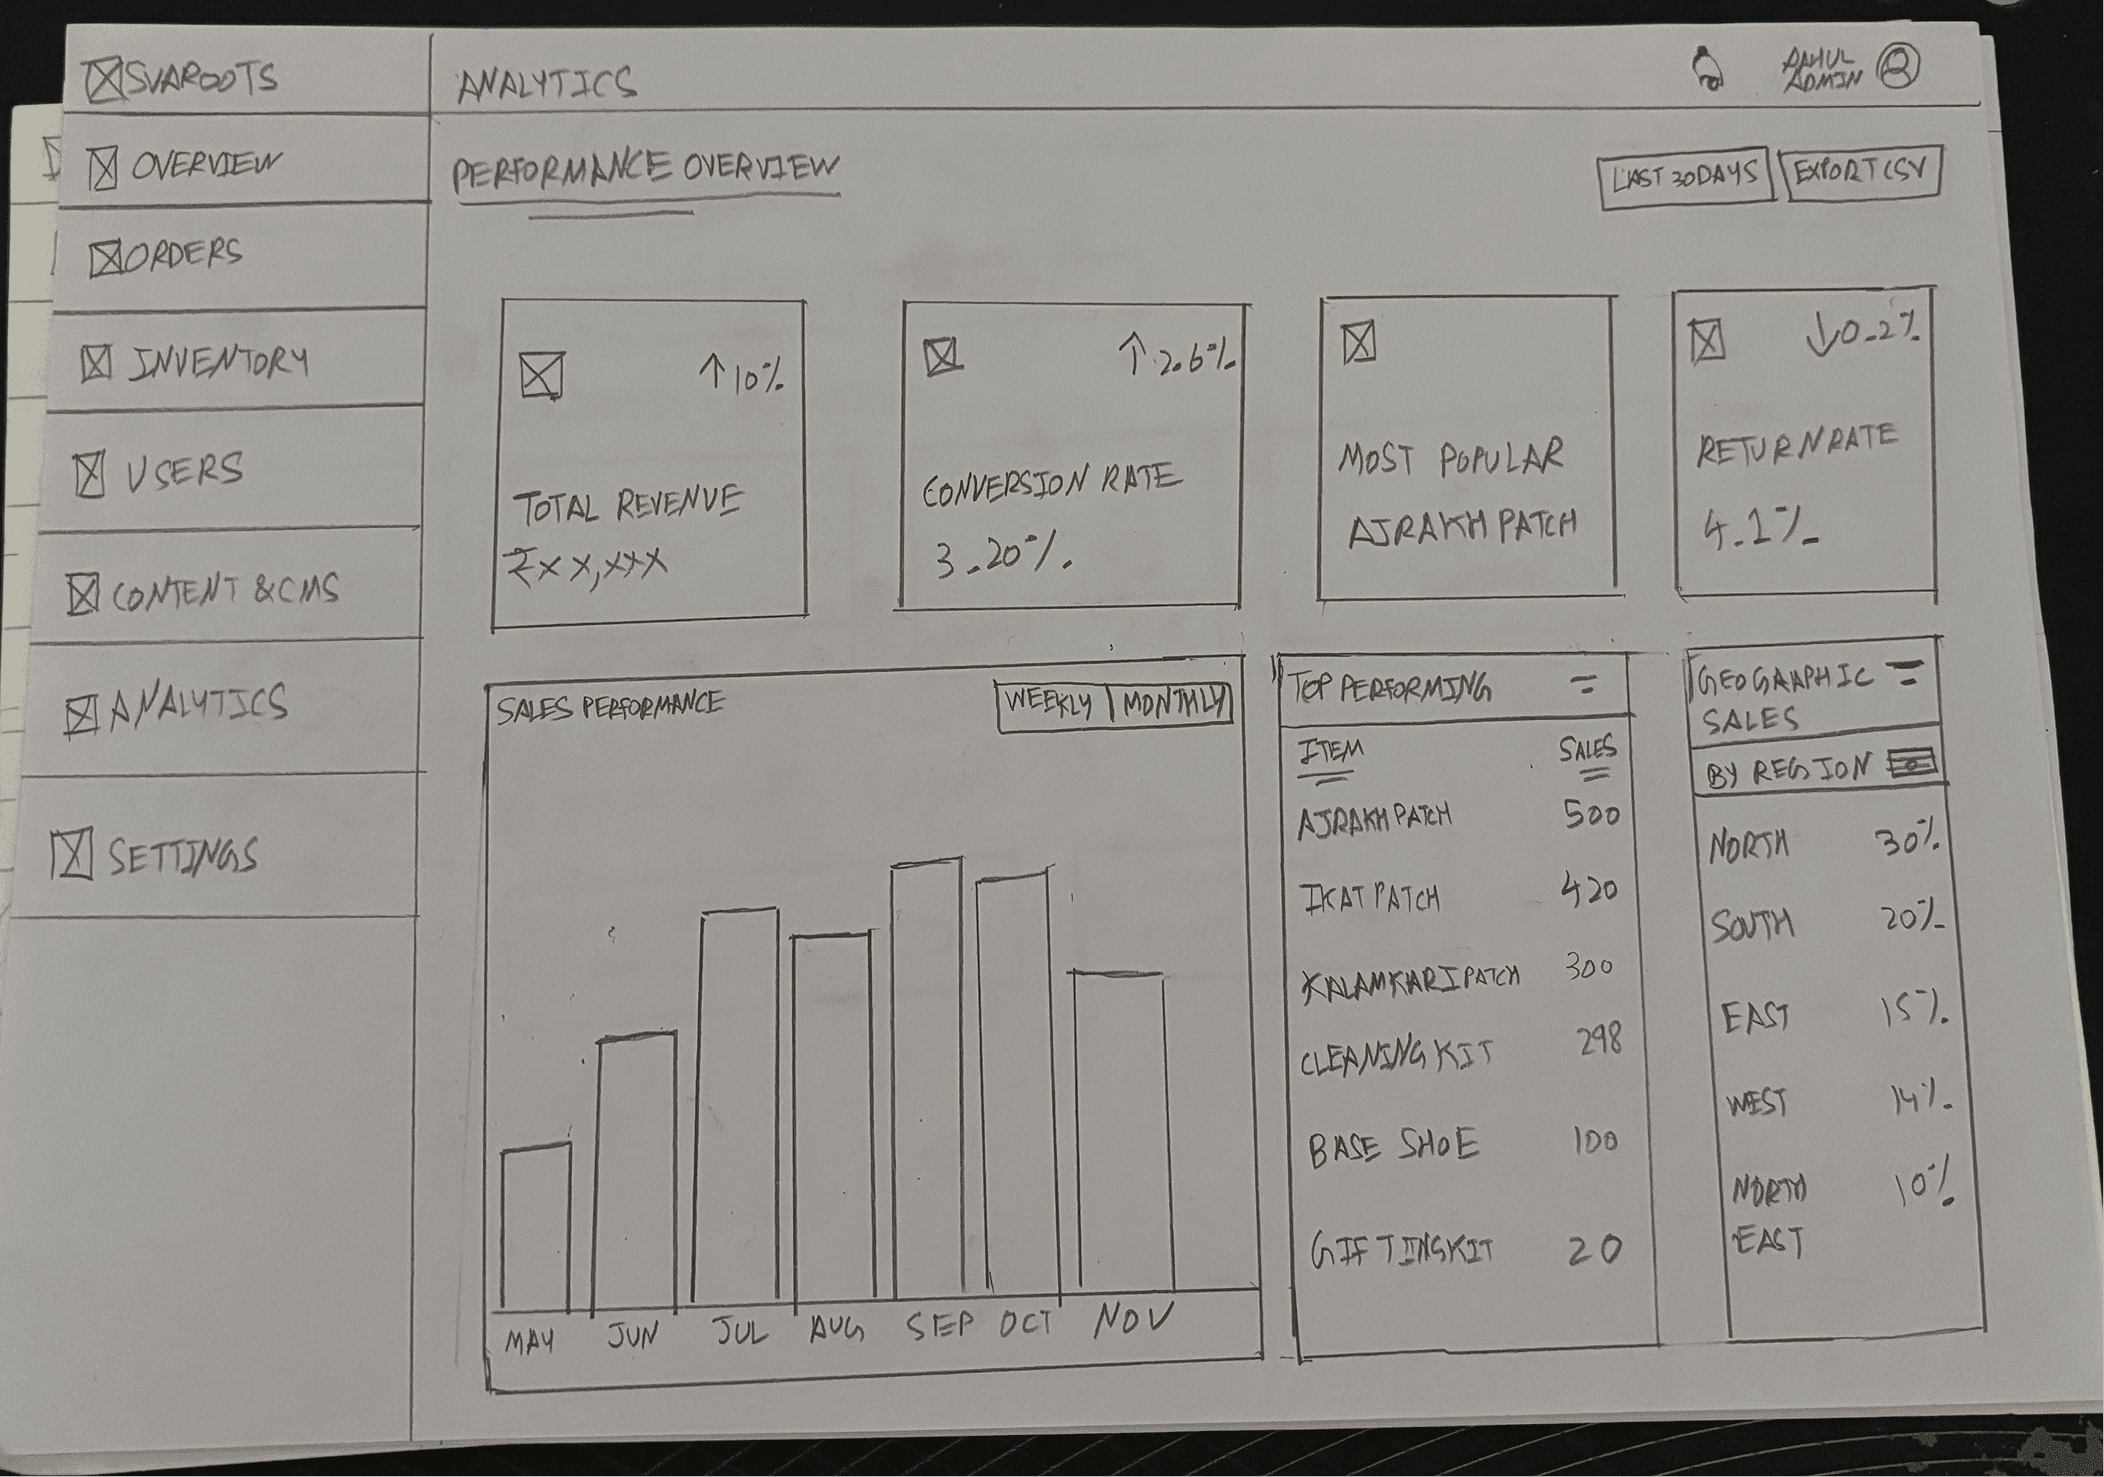
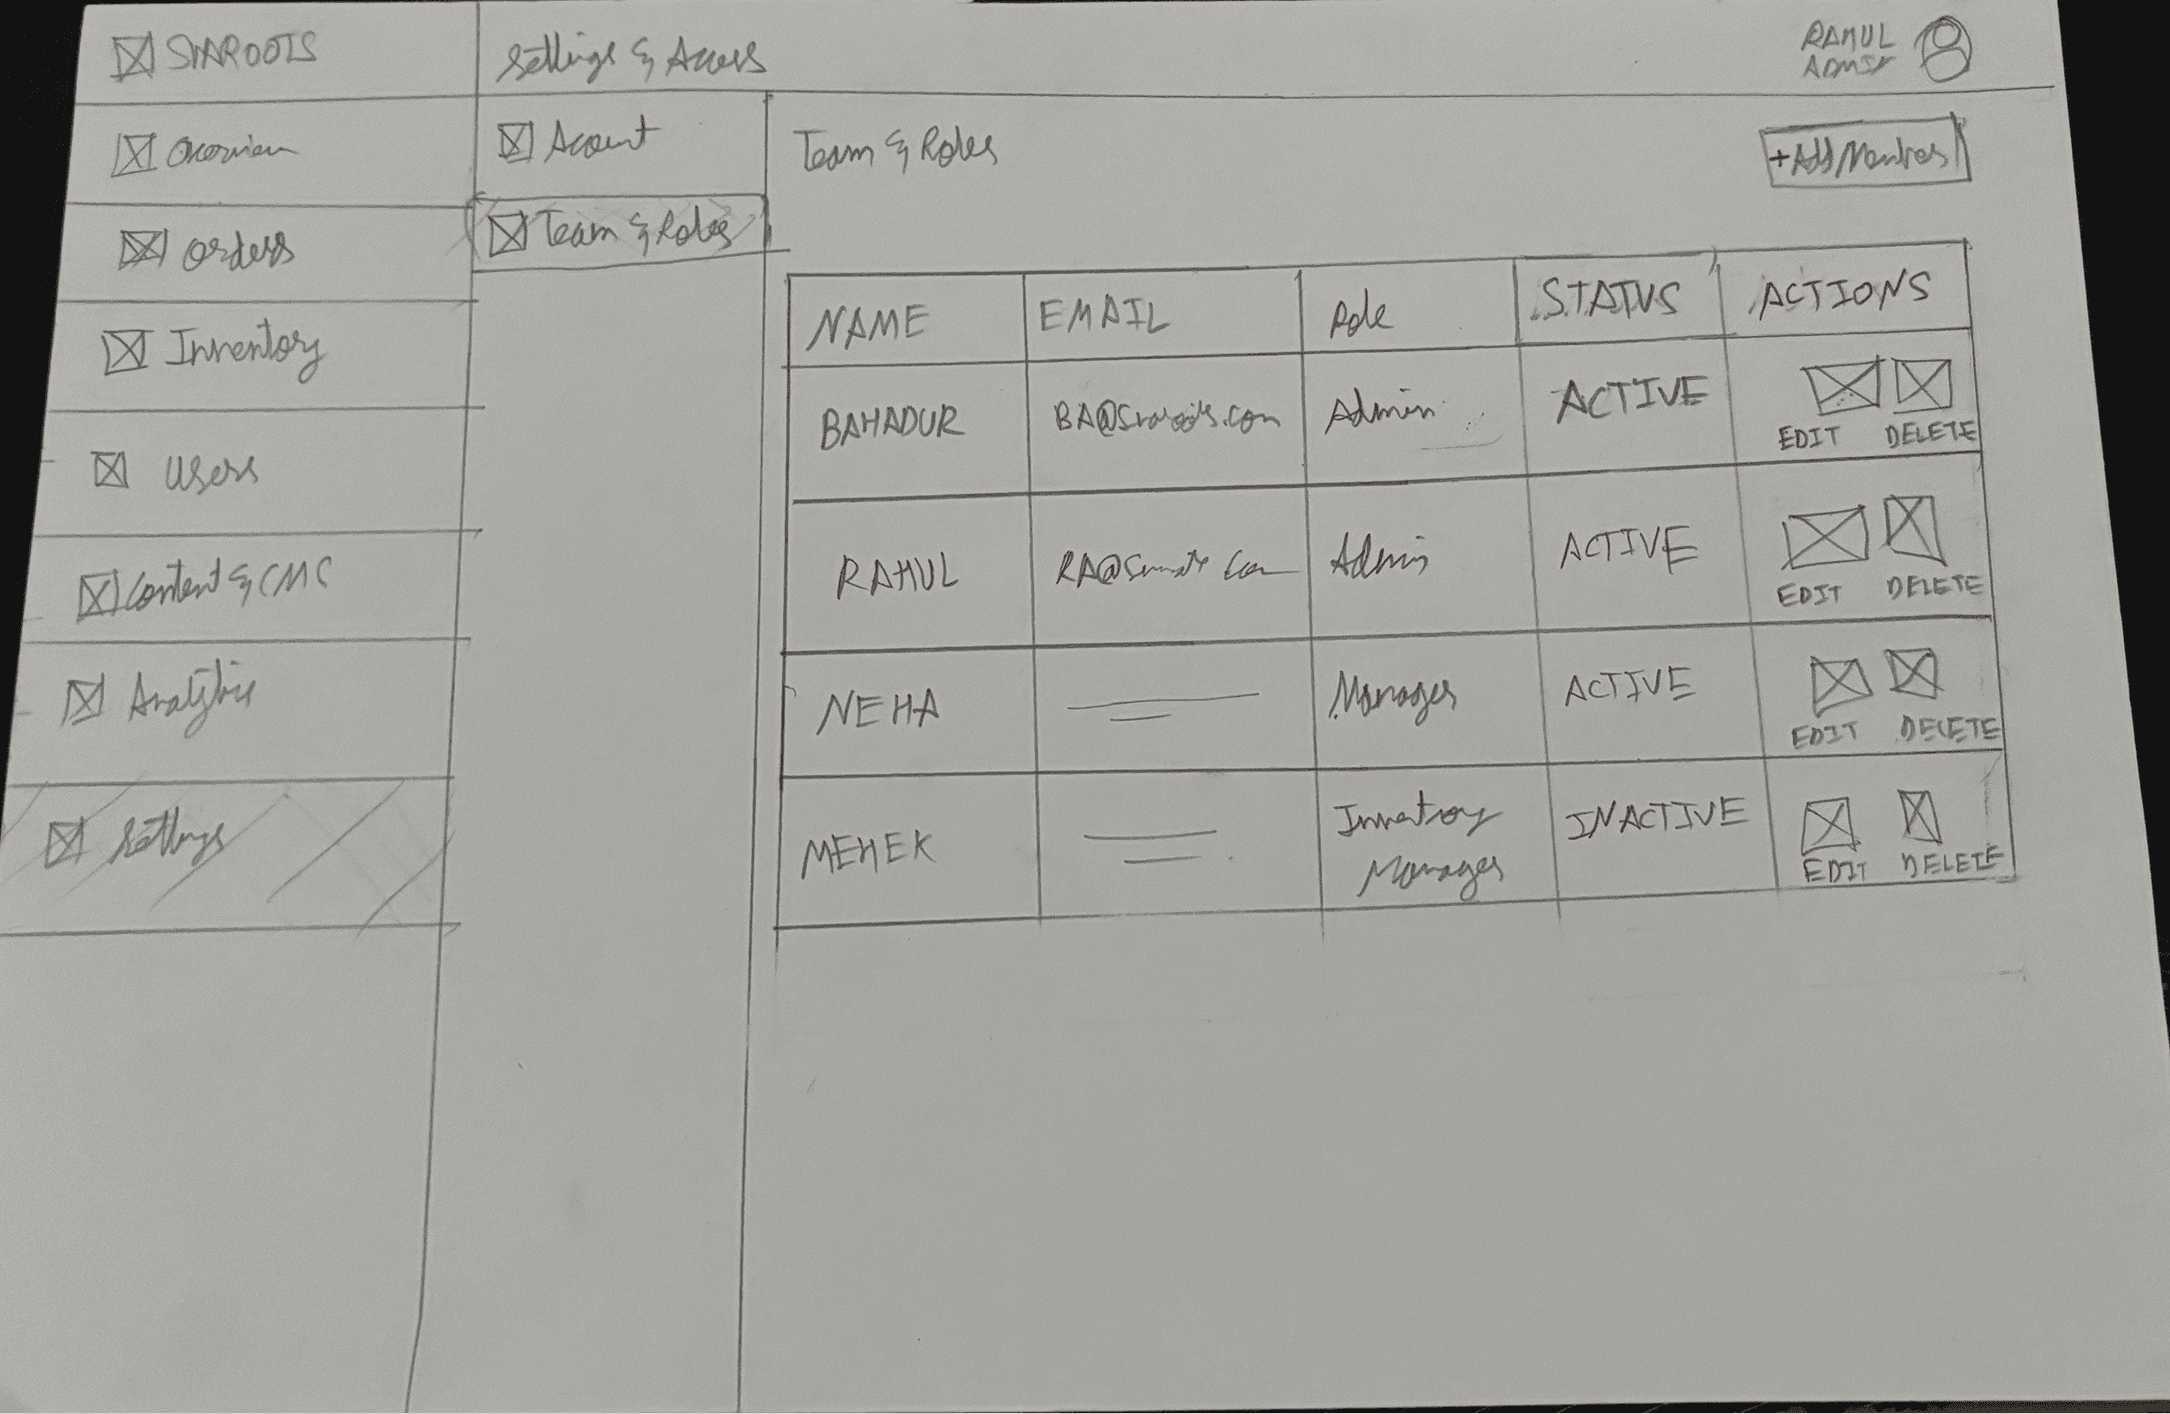
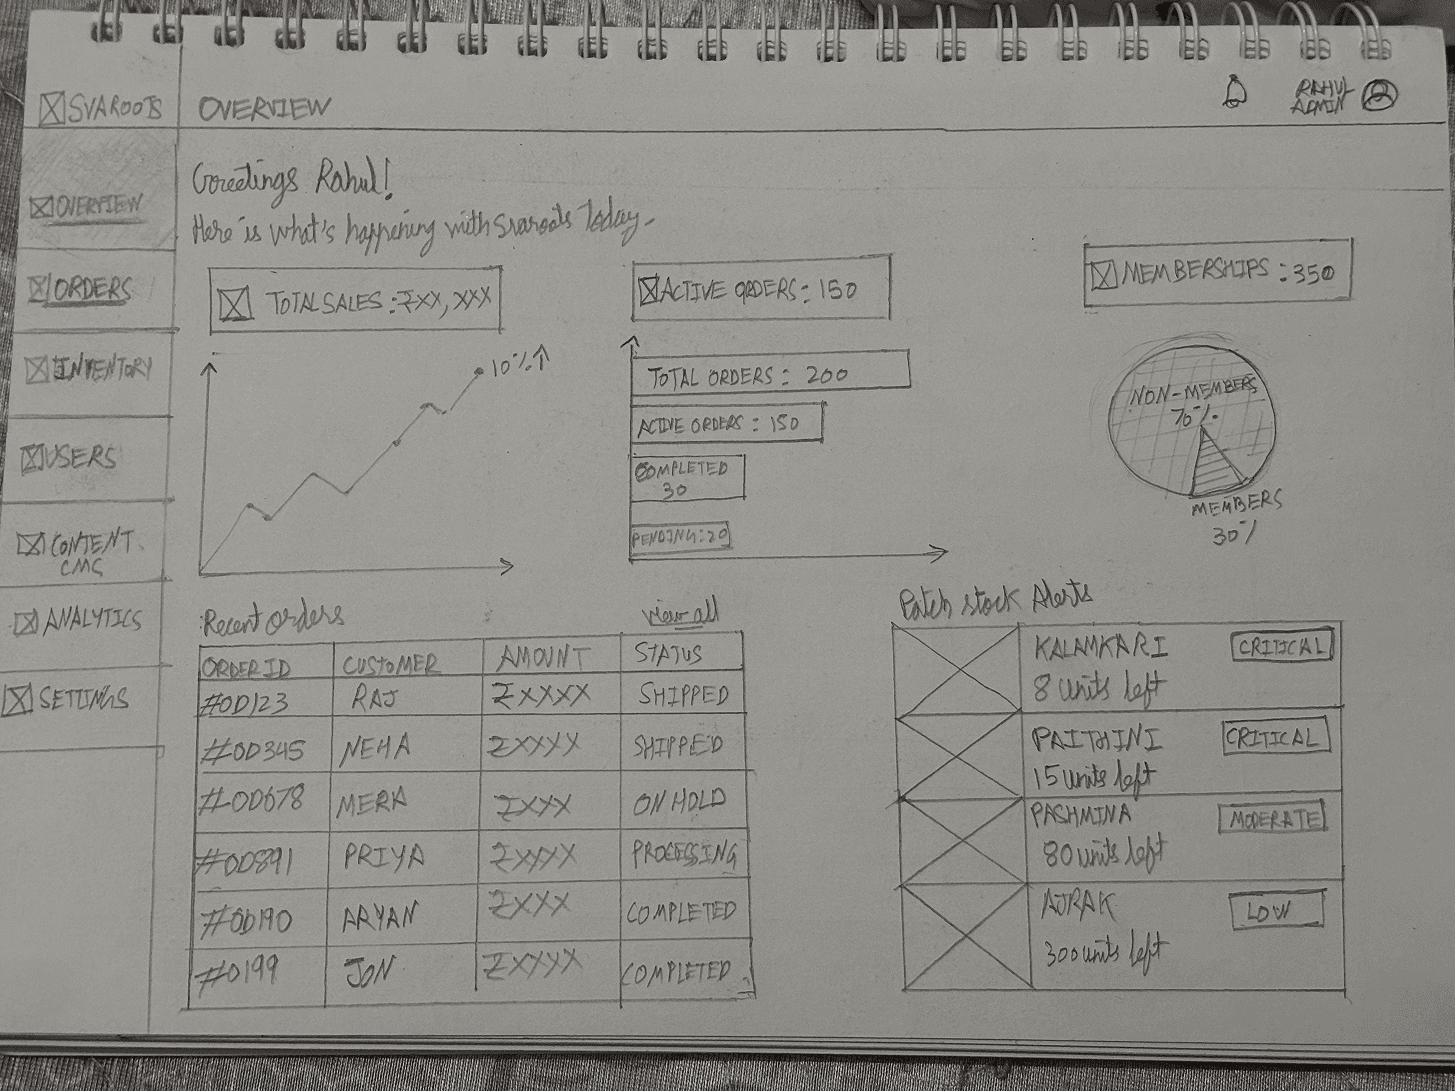
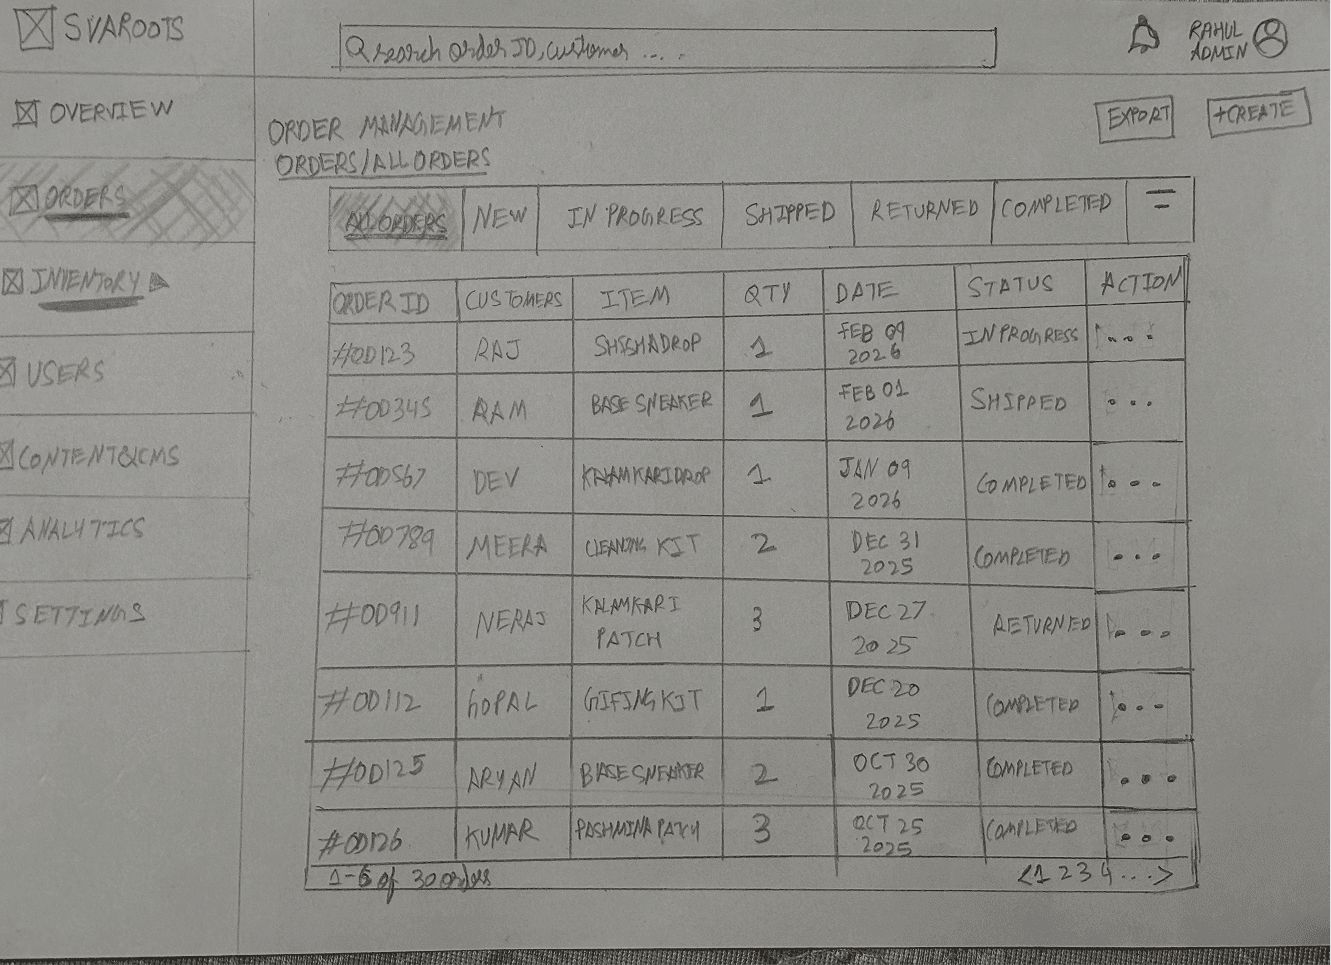
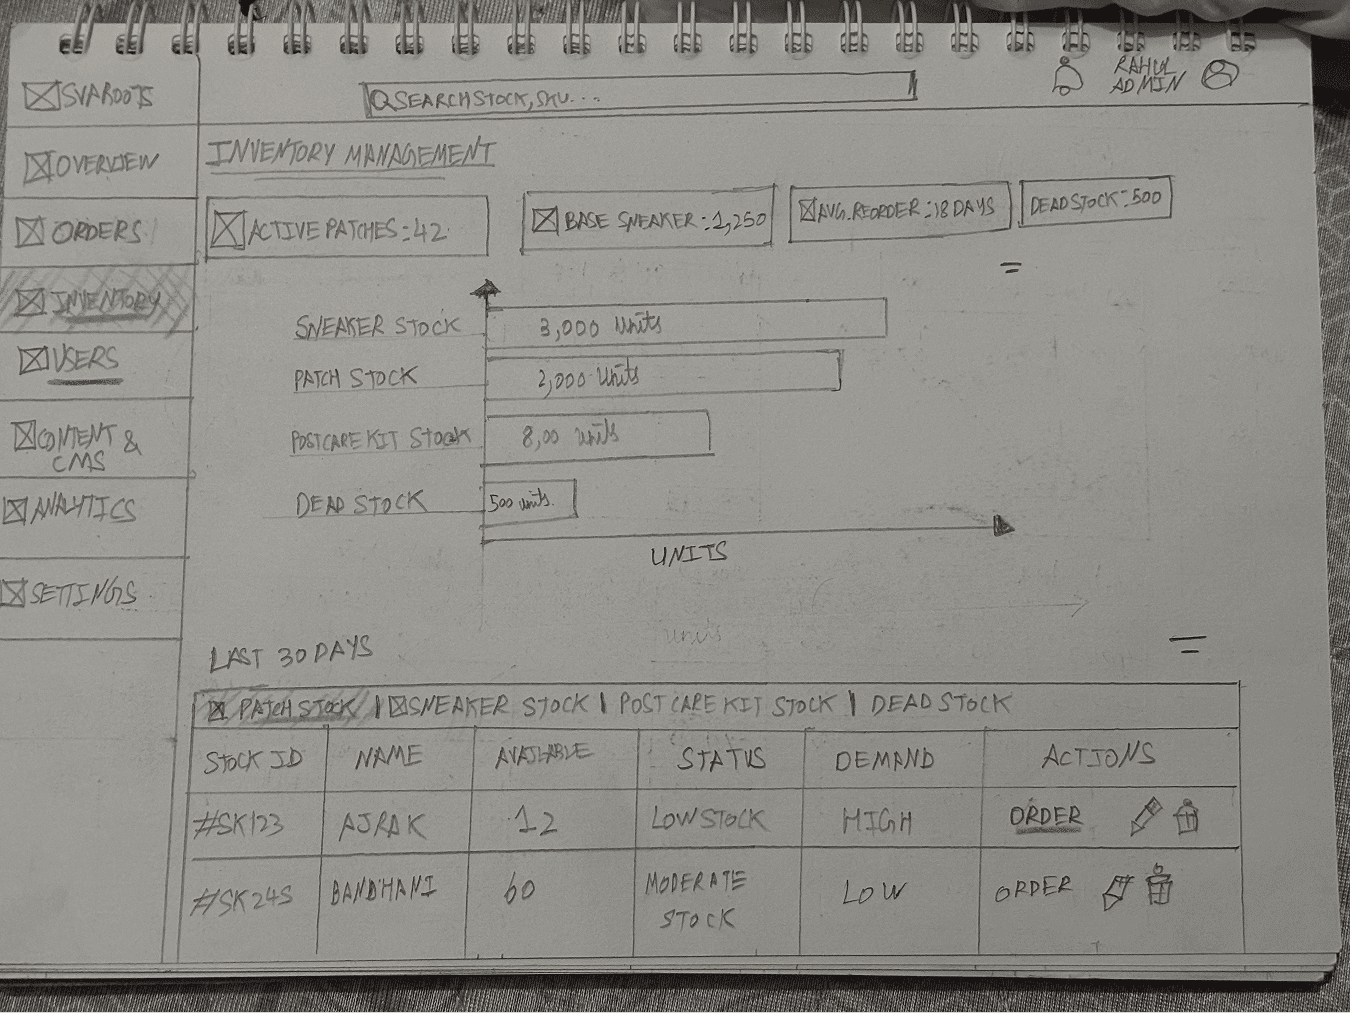
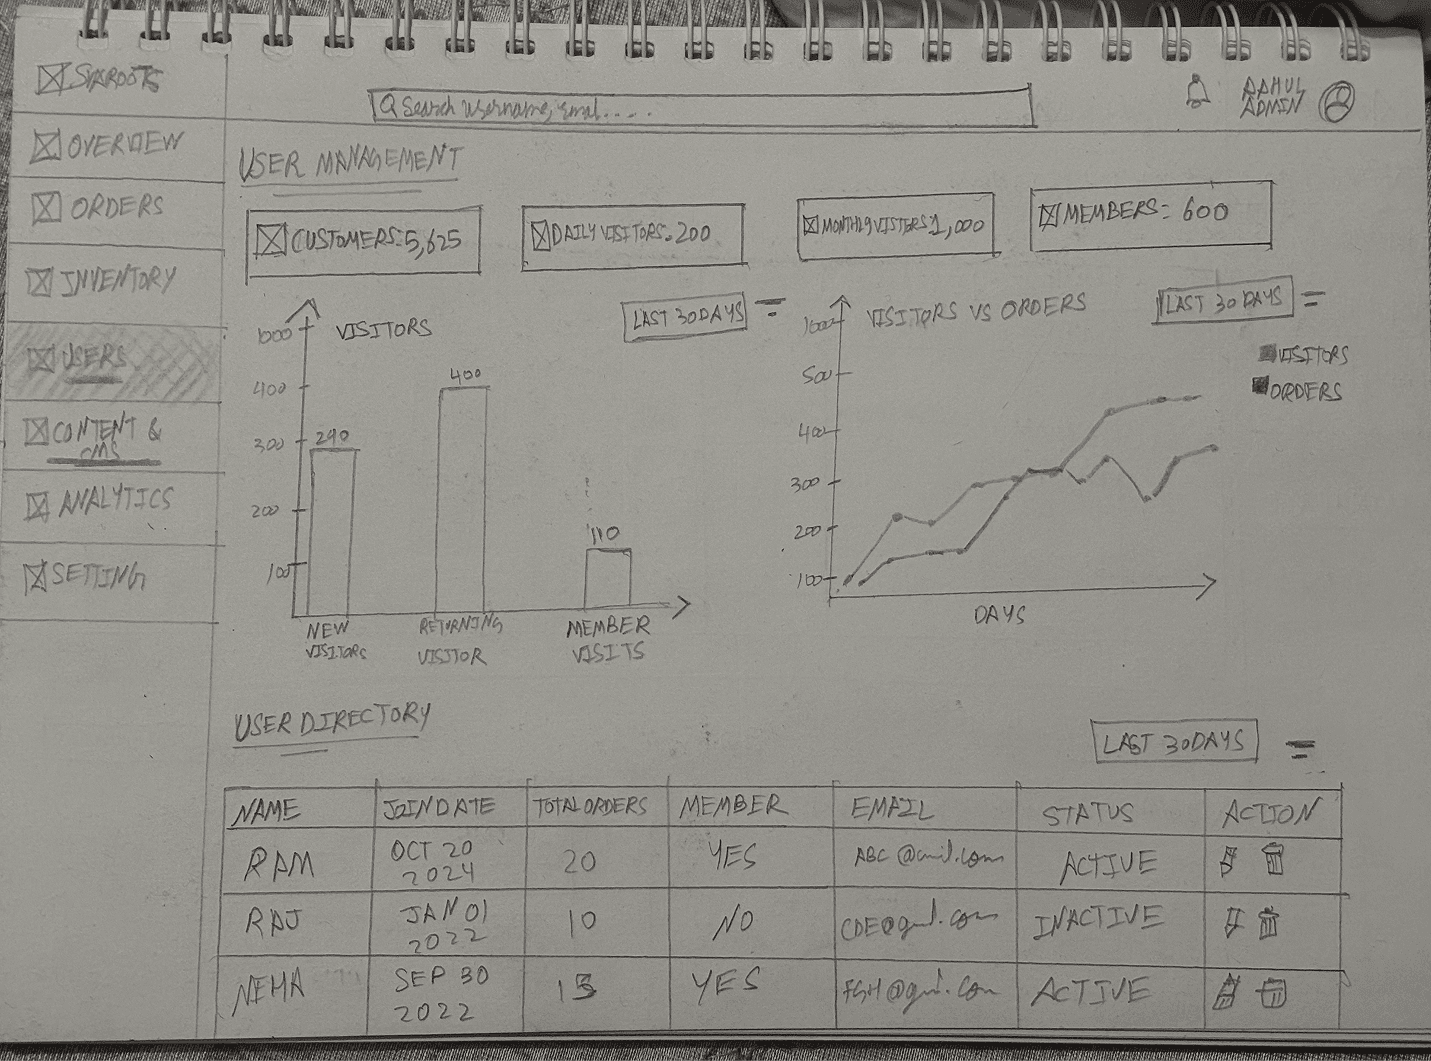
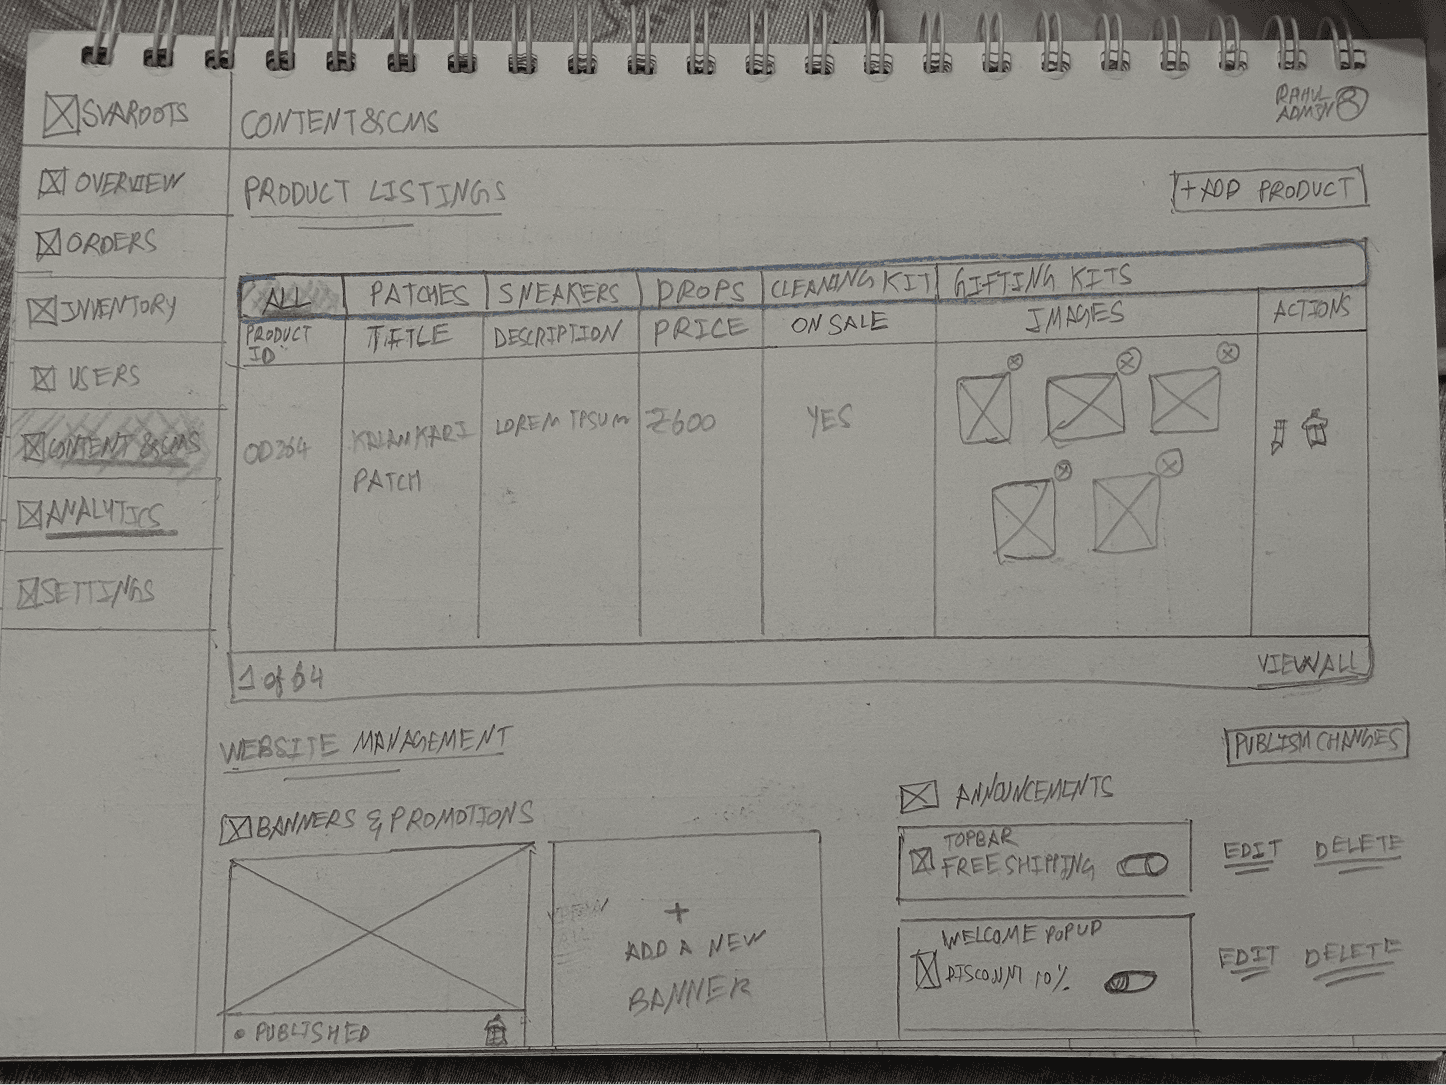
Sketches before pixels.
Low-fi paper wireframes used to test flow and hierarchy before any pixels were pushed.
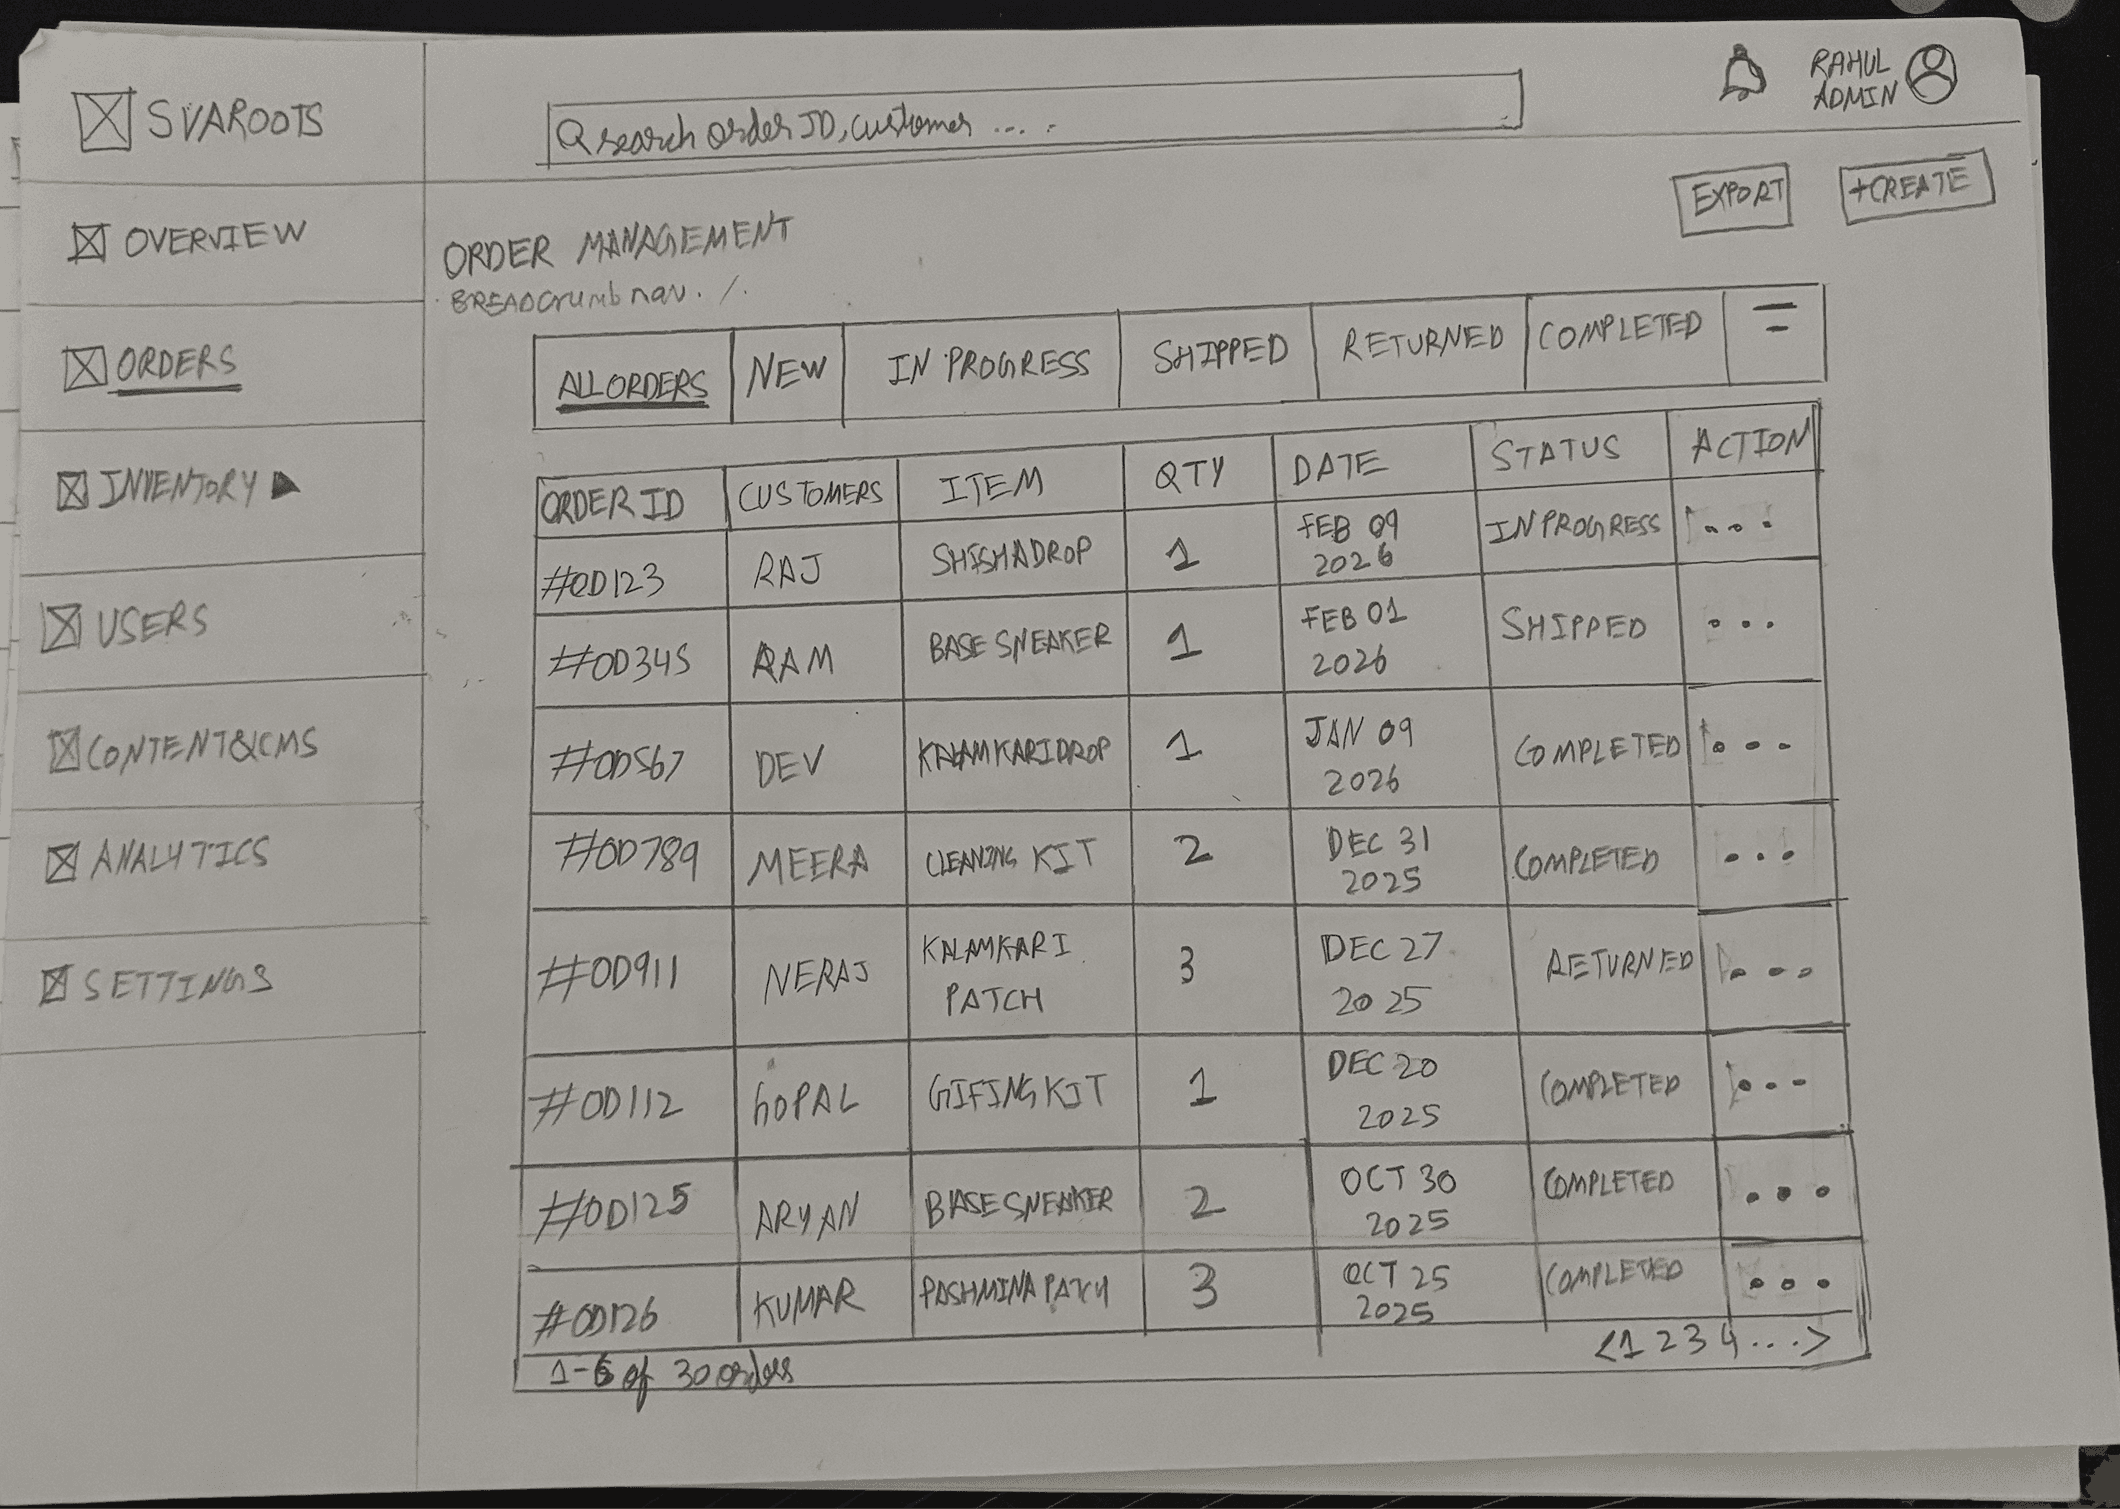
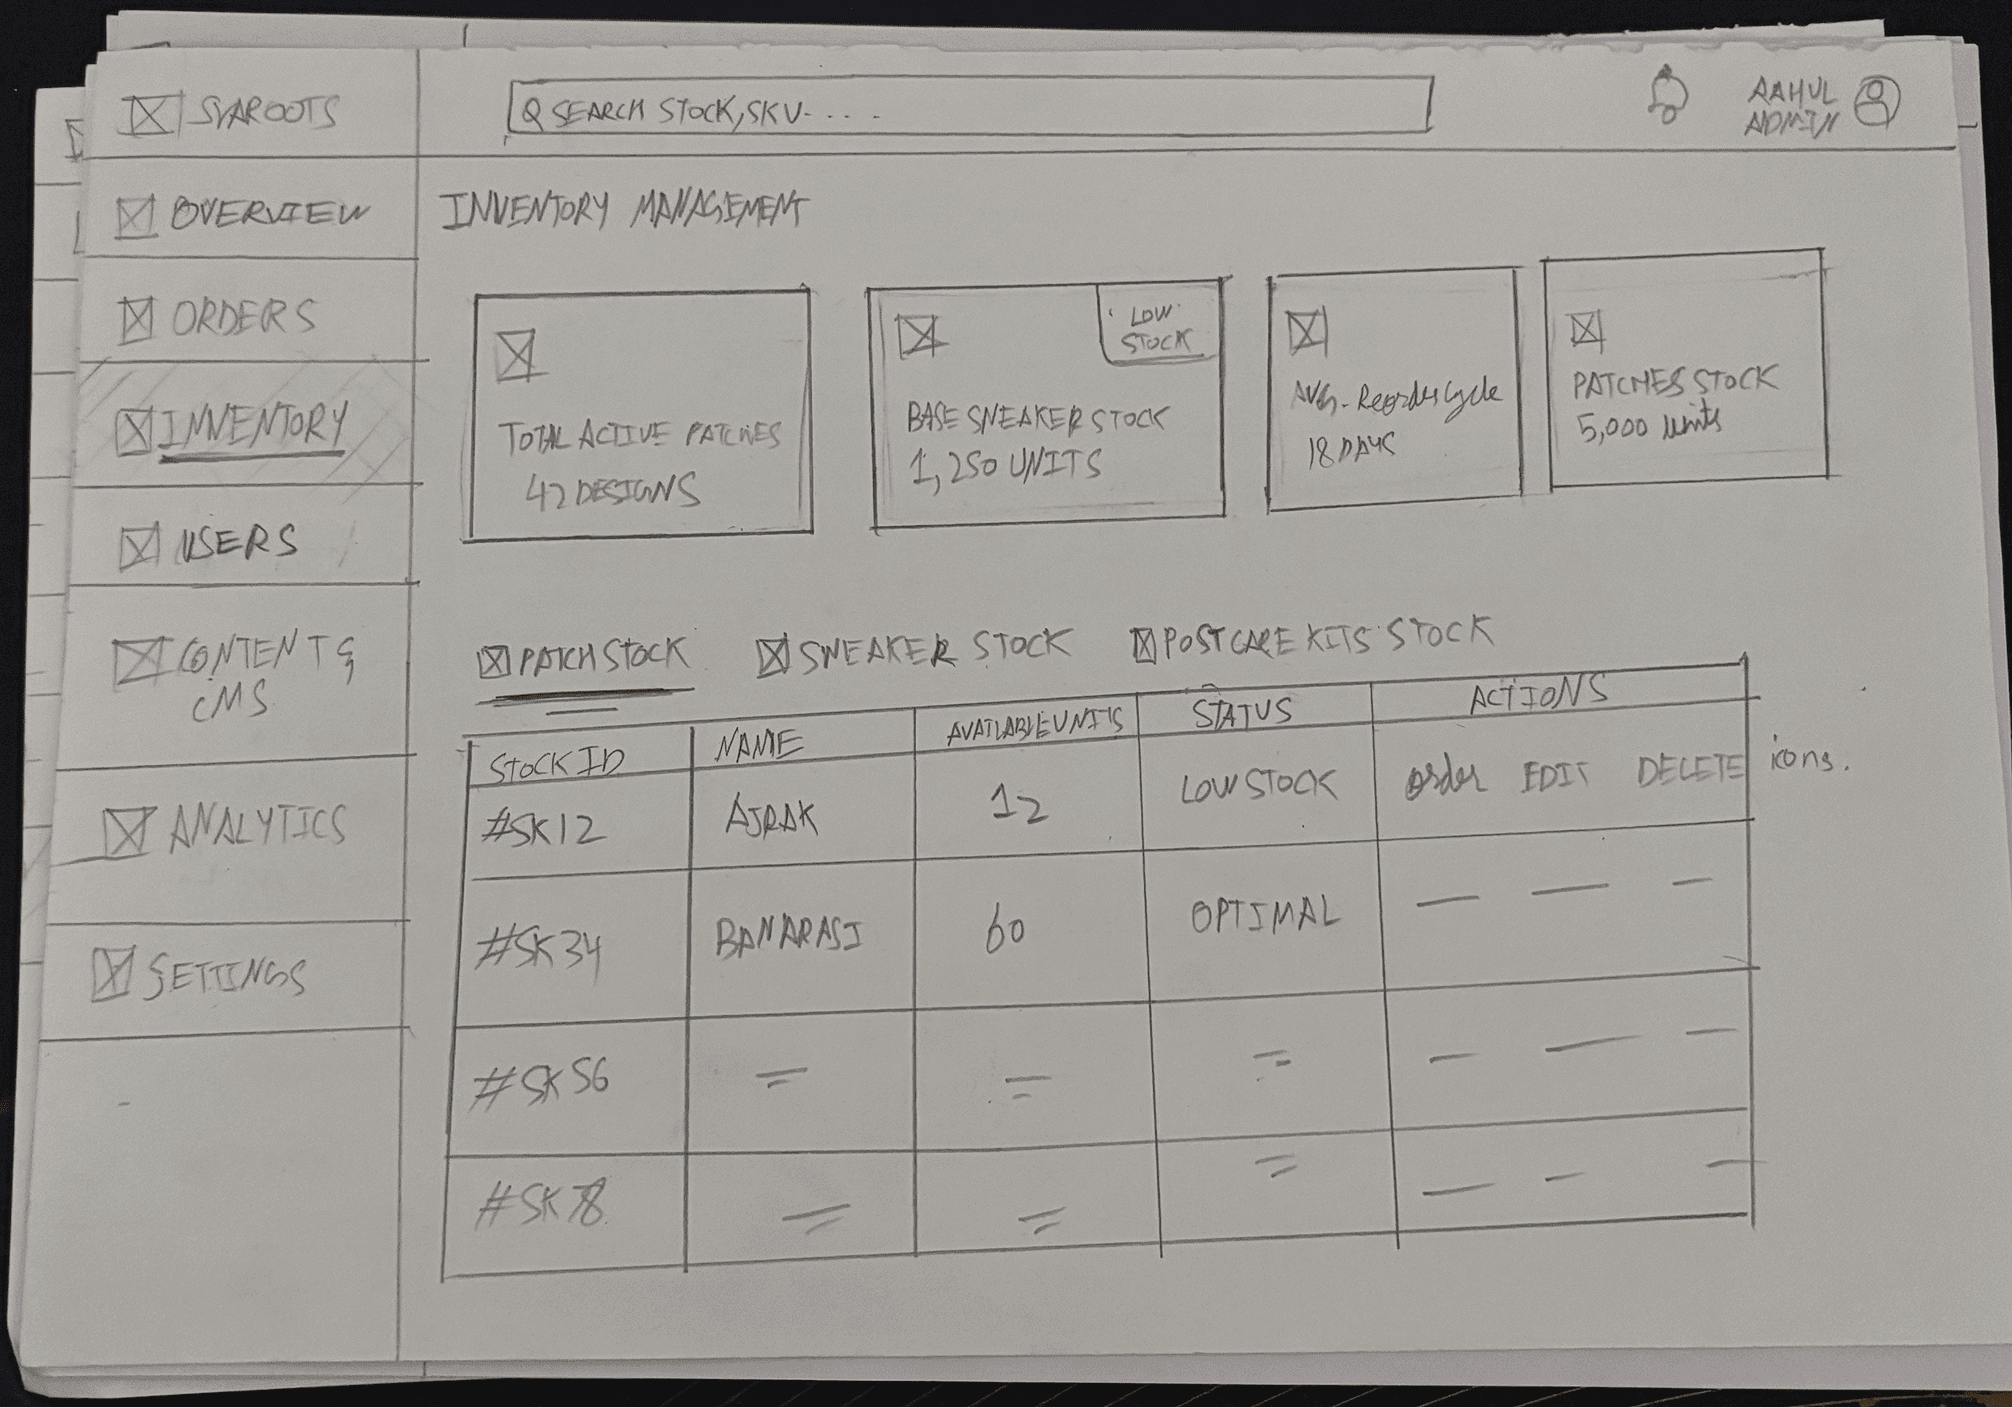
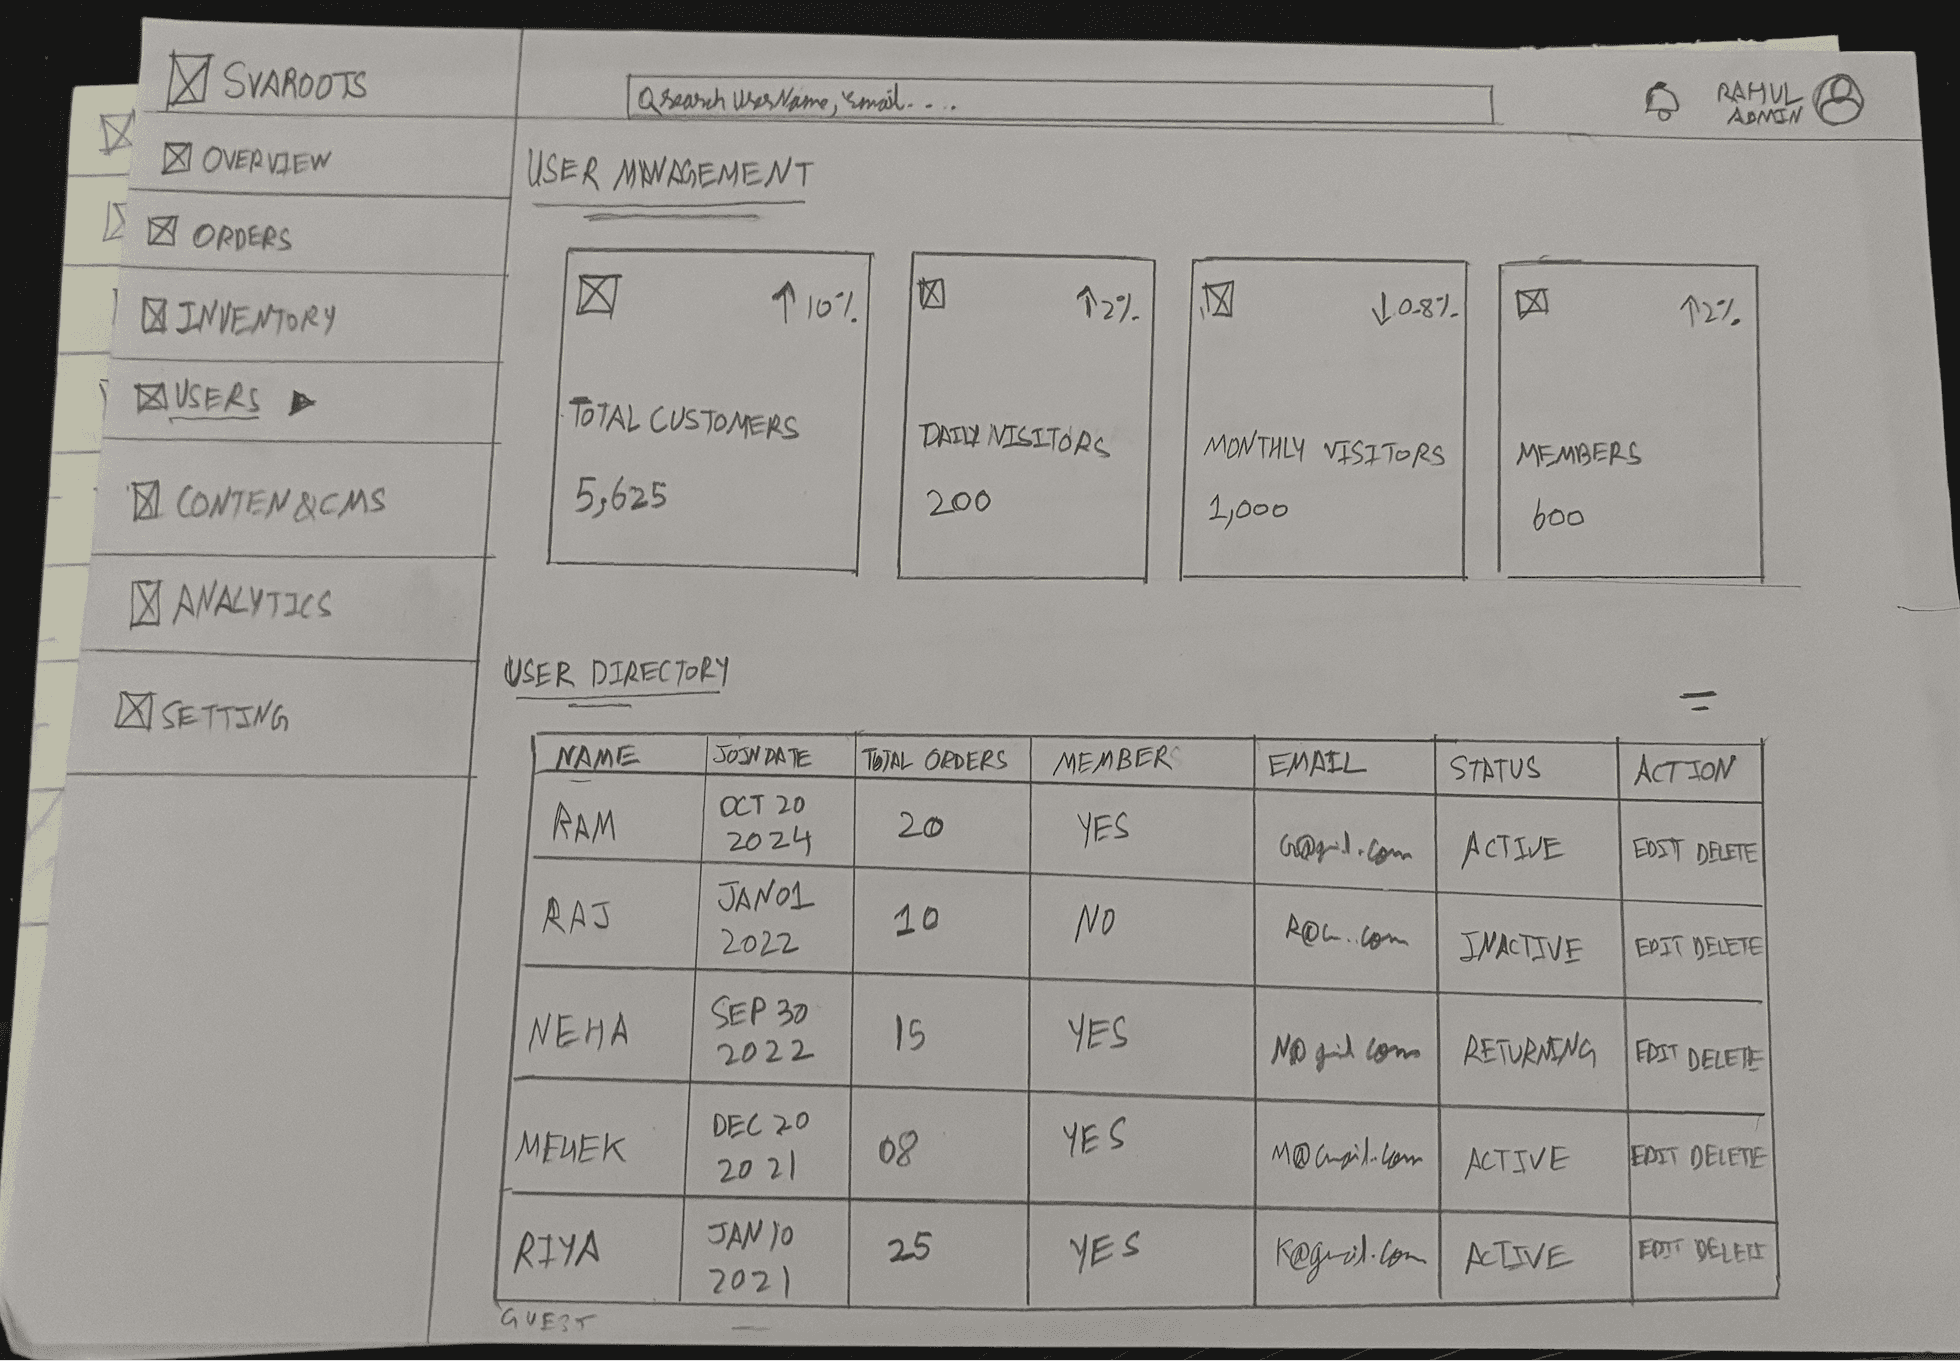
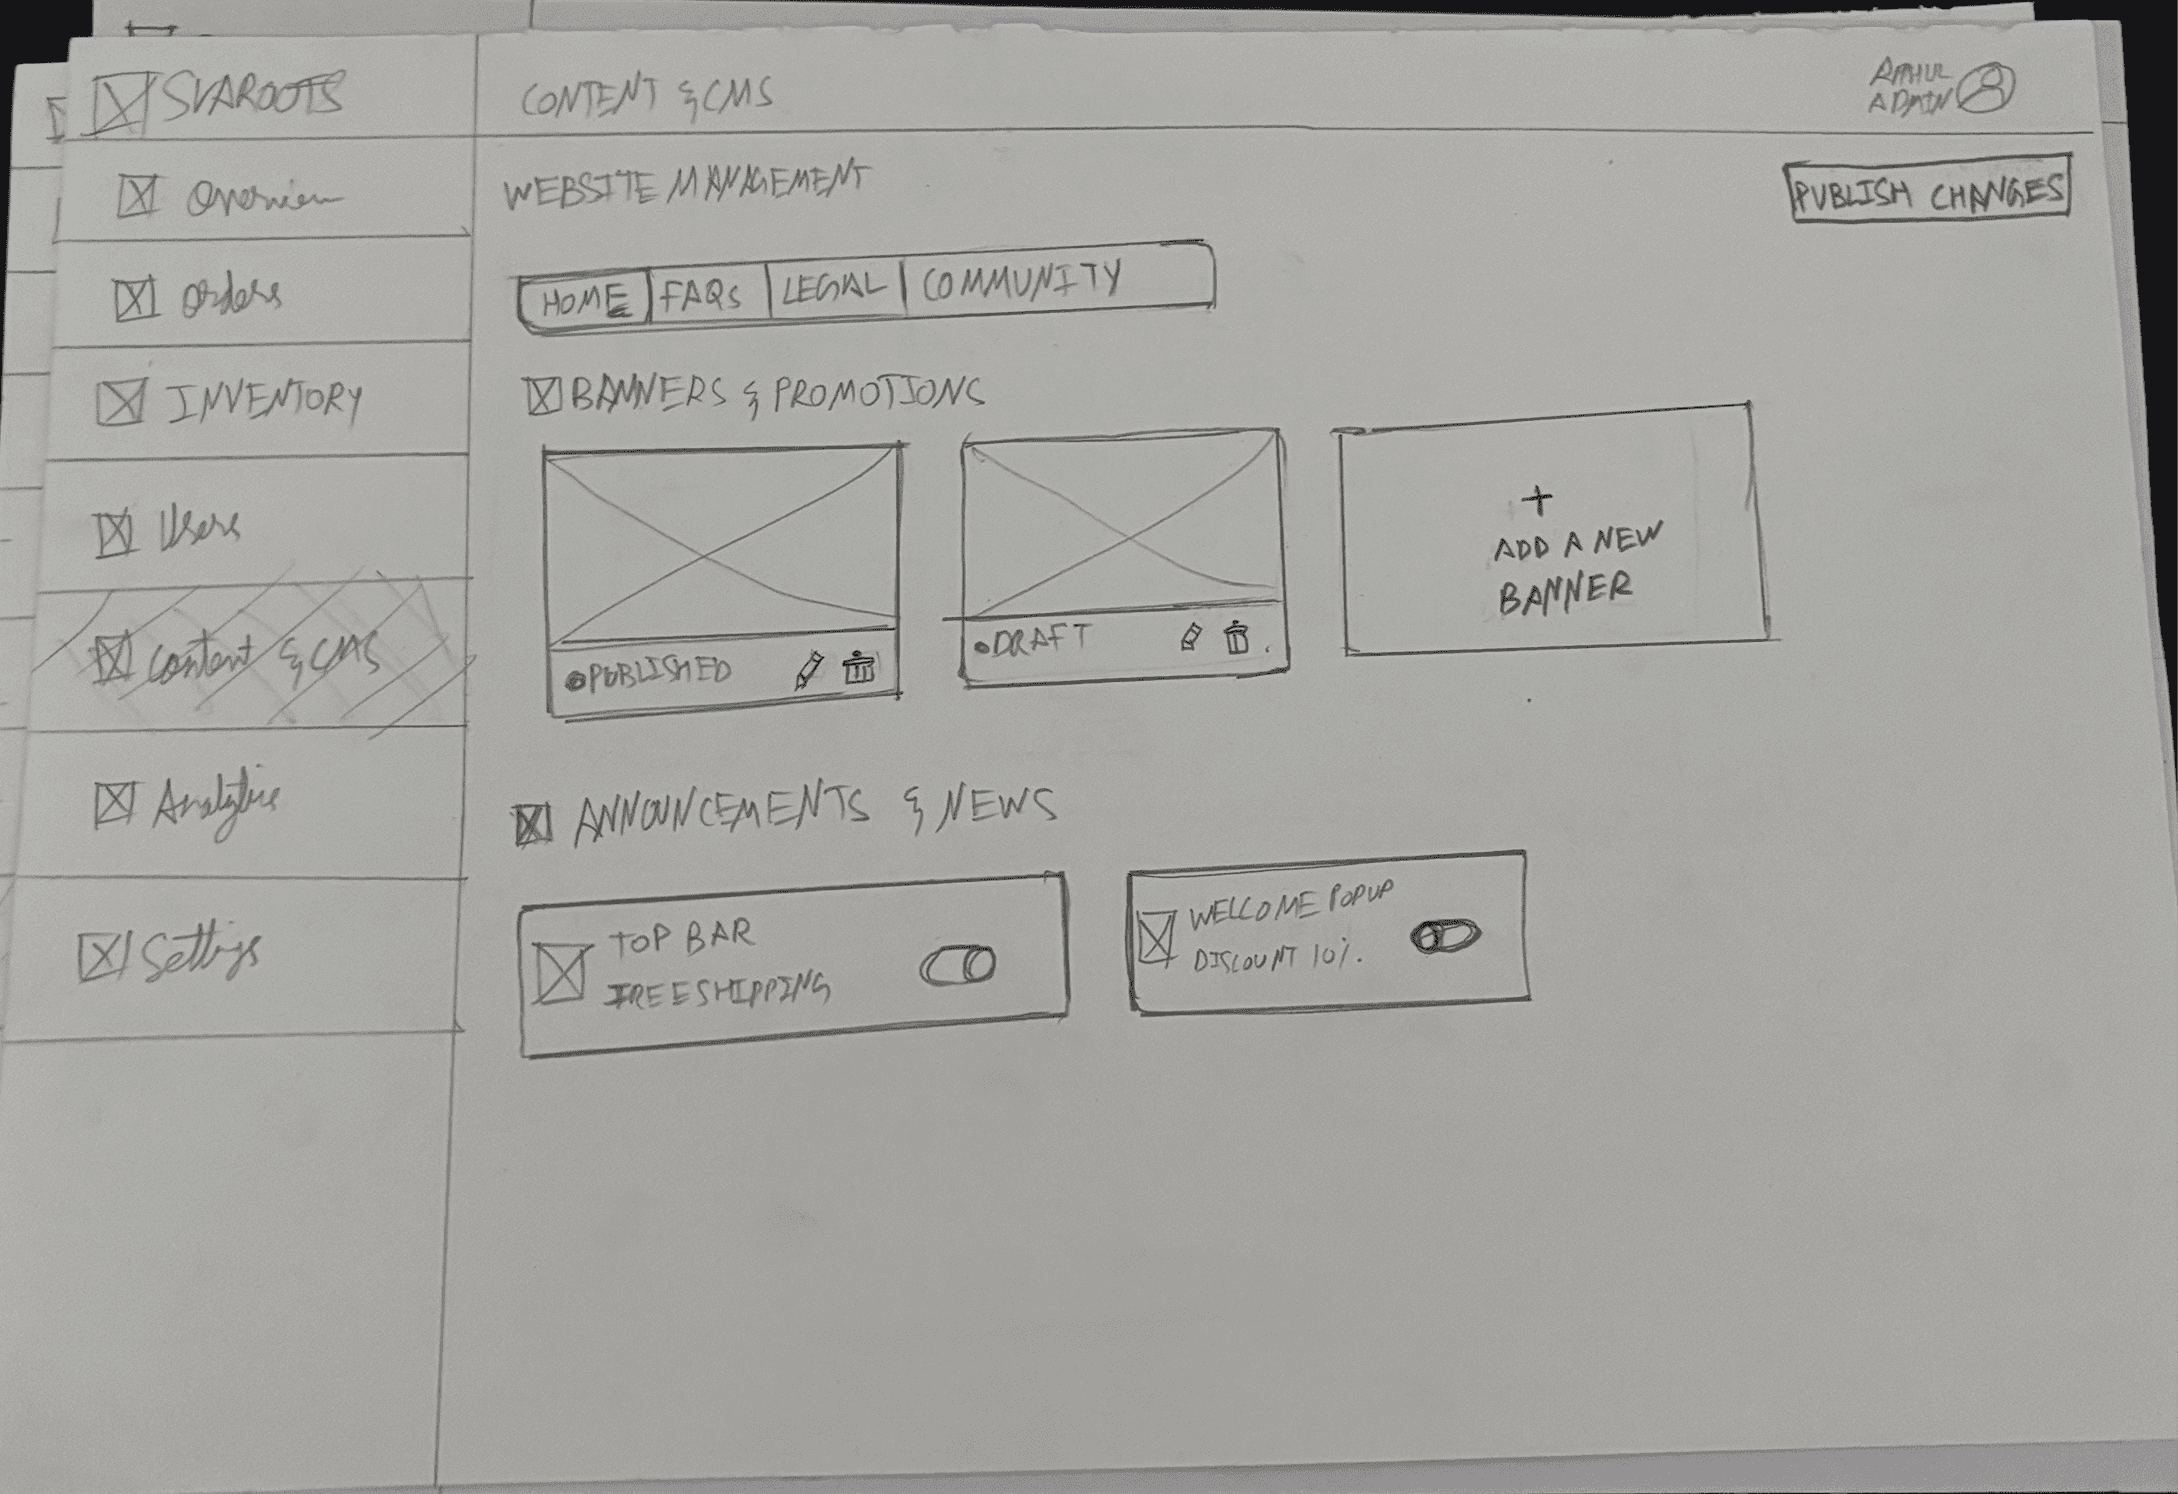
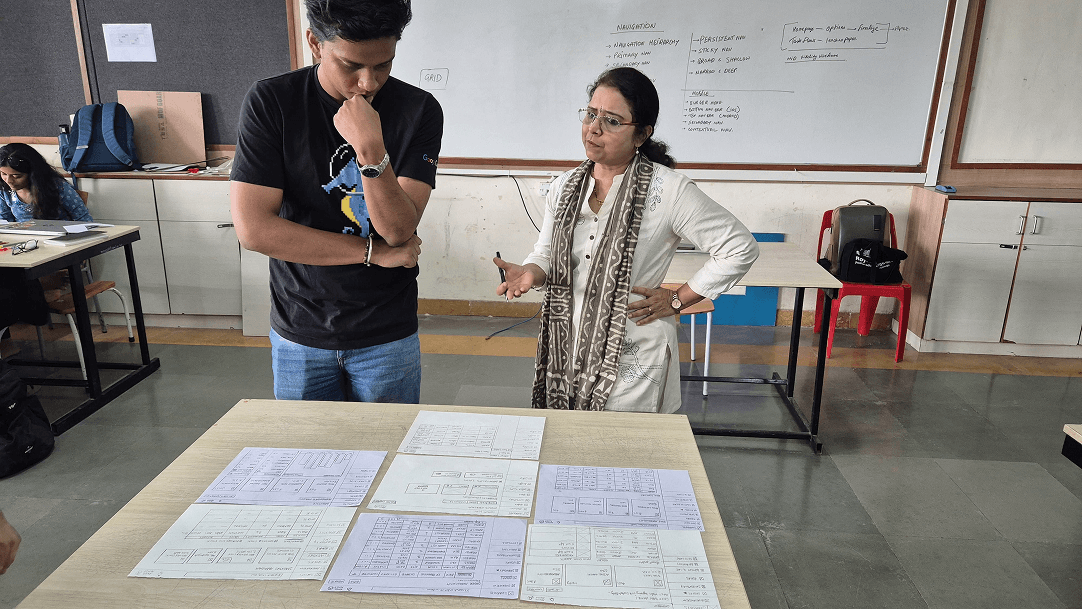
What users actually said.
Direct feedback from real users that shaped the final flows.
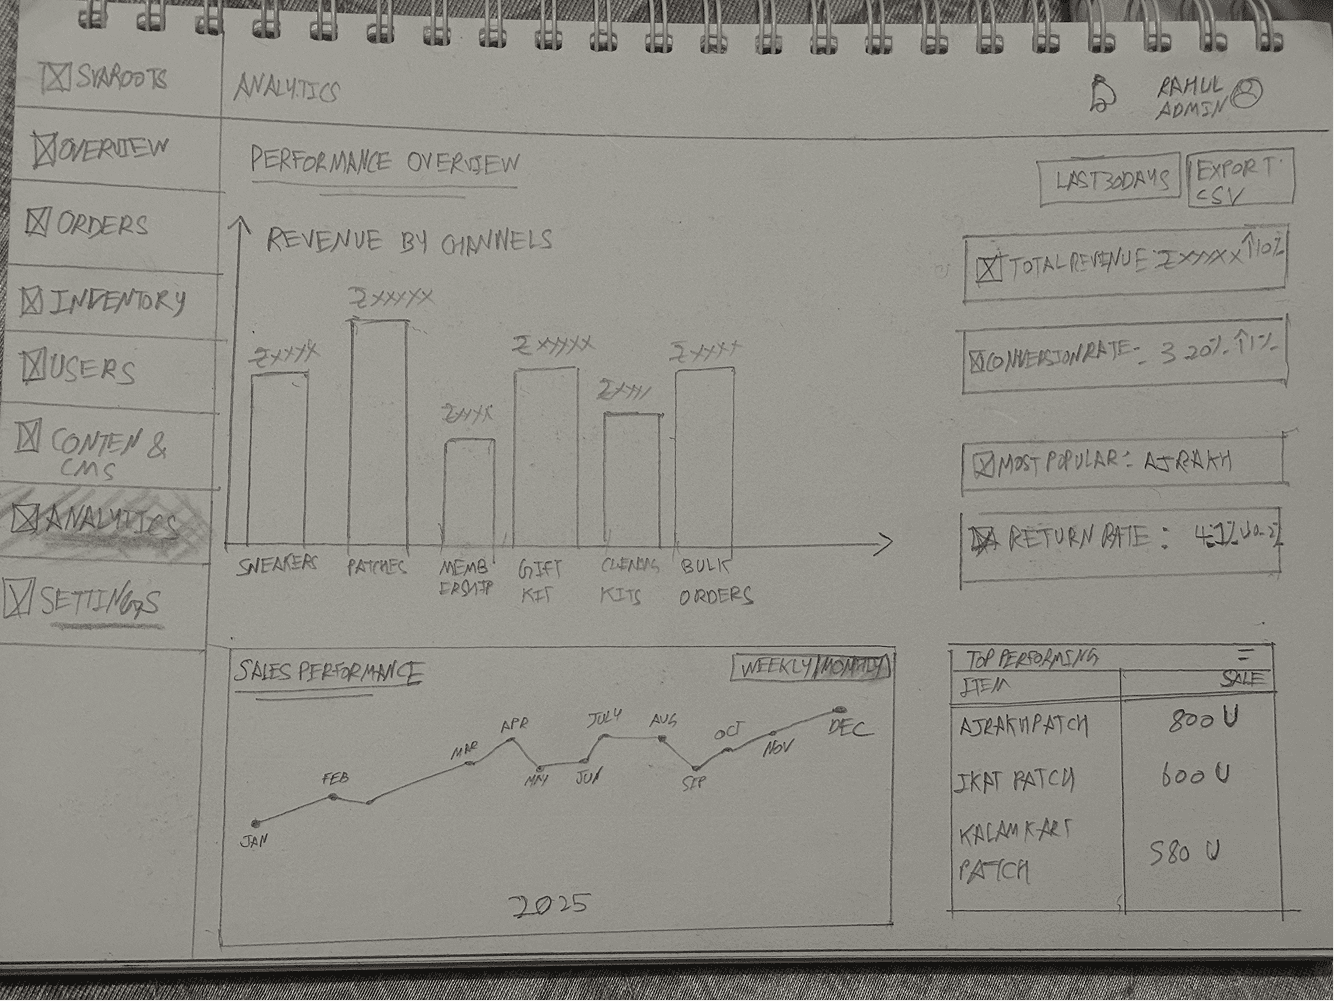
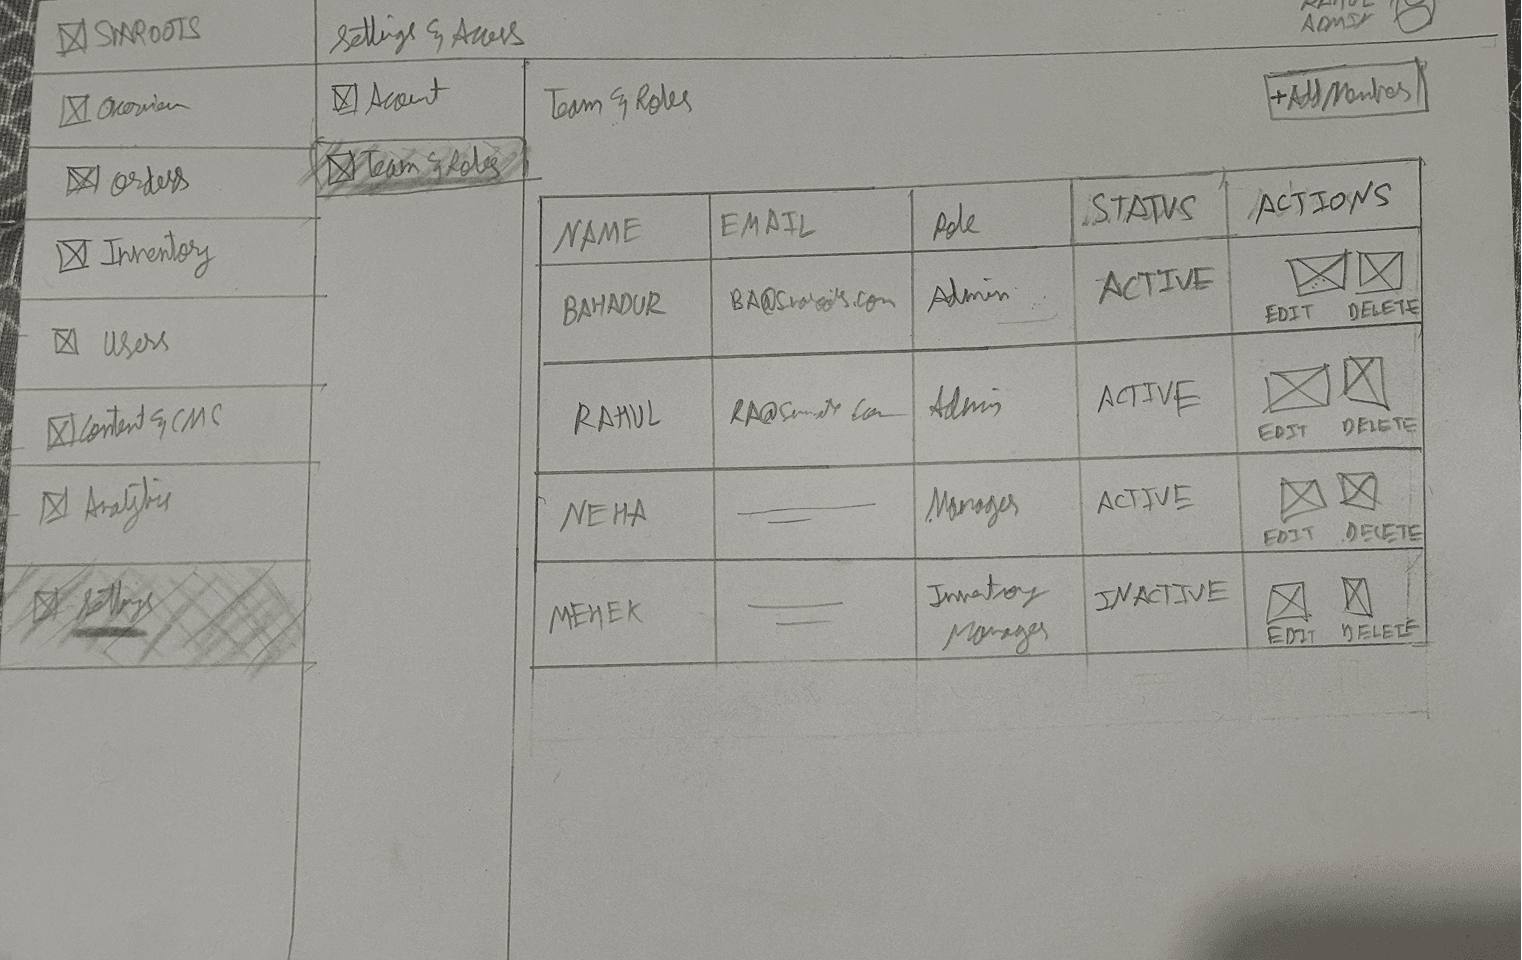
Seven screens, one sidebar.
Each screen answers a different question about the business.
What is happening right now?
KPIs, customer split, traffic sources, regional insights, recent orders.
Where is each order?
Status tabs, CSV export, patch names, delivery addresses.
What do we have?
Category tabs, stock levels, Size Run Health Bar, dead stock management, inventory runway.
Who are our customers?
CLV INR 12,500, repeat purchase rate, at-risk users, segmentation.
What is the storefront showing?
Products, banners, campaigns and drops, stories, visibility, publish status.
What does it all mean?
Revenue by category, patch-to-sneaker ratio, top products, customisation rate, campaign impact.
A system built for density.
The dashboard runs on a custom design system built in Figma with tokens, components, and charts, all bound to Variables.
Typography, color tokens, spacing, components.
Inventory is not one list.
Patches, sneakers, drops, cleaning kits, and gifting kits each have different stock logic. I designed a tabbed system with category-specific views, a Size Run Health Bar for Indian sizing, and a dedicated dead stock section. ↳ Inventory structures were organized around modular relationships rather than fixed products to better support interchangeable footwear systems.
Five product types sharing one screen.
Patches sell fast with low/moderate alerts. Sneakers move slower but need size granularity. Drops are time-limited. A single table would bury the differences.
- Category tabs. Patches, Drops, Sneakers, Cleaning Kit, Gifting Kit. Each shows only what matters for that type.
- Size Run Health Bar. Demand across IND 7 to IND 11. Low, Moderate, High at a glance.
- Dead Stock section. Slow-moving items surfaced with units and reorder actions.
- Inventory Runway. Headline metric (6 months) so operators know stock duration instantly.
Screen 01 Inventory / category tabs / stock table / Size Run Health Bar / dead stock
Metrics only a modular brand needs.
Svaroots needed to know the relationship between patches and sneakers, the customisation rate, and which campaigns moved numbers. Post-purchase lifecycle metrics were prioritized to surface usage patterns beyond traditional sales reporting.
Custom metrics for a modular model.
Patch-to-sneaker ratio, customisation rate, campaign impact, and revenue by category became the dashboard's core lens.
- Patch-to-Sneaker Ratio. Helps monitor balance across modular product categories.
- Customization Rate. Measures engagement across interchangeable product configurations.
- Campaign Performance. Tracks engagement across seasonal modular collections.
- Revenue by Category. Visualizes contribution across modular product categories.
Screen 02 Analytics / revenue by category / patch-to-sneaker ratio / top products / insights
Four screens that complete the loop.
Overview for the morning glance, Orders for fulfilment, Users for lifecycle, Content & CMS for storefront control.
Shows what changed overnight, so the morning starts informed.
Surfaces fulfilment status so nothing slips between stages.
Flags at-risk customers before churn becomes silent.
Lets the team update storefront content without engineering help.
Controls who can do what without surfacing risk to operations.
Click through all seven screens.
The full operator flow, clickable in your browser. Every sidebar link works.
What this project expanded.
Designing the dashboard expanded Svaroots beyond storefront interactions into the operational systems behind modular commerce experiences. The project pushed me to think beyond interfaces and consider how operational visibility shapes modular product experiences.
The product model shapes the IA.
Patches, sneakers, drops, kits. Once I stopped treating them as "products" and gave each a dedicated tab, the inventory screen stopped feeling like a spreadsheet.
Invent the metrics the business needs.
Patch-to-sneaker ratio and customisation rate do not exist in Shopify. If the business model is new, the dashboard metrics have to be new too.
Seven screens is a system, not seven pages.
Shared components, shared tokens, shared table patterns. The design system is what makes seven screens feel like one product.